
Qualitative Data Coding 101
How to code qualitative data, the smart way (with examples).
By: Jenna Crosley (PhD) | Reviewed by:Dr Eunice Rautenbach | December 2020
As we’ve discussed previously , qualitative research makes use of non-numerical data – for example, words, phrases or even images and video. To analyse this kind of data, the first dragon you’ll need to slay is qualitative data coding (or just “coding” if you want to sound cool). But what exactly is coding and how do you do it?
Overview: Qualitative Data Coding
In this post, we’ll explain qualitative data coding in simple terms. Specifically, we’ll dig into:
- What exactly qualitative data coding is
- What different types of coding exist
- How to code qualitative data (the process)
- Moving from coding to qualitative analysis
- Tips and tricks for quality data coding

What is qualitative data coding?
Let’s start by understanding what a code is. At the simplest level, a code is a label that describes the content of a piece of text. For example, in the sentence:
“Pigeons attacked me and stole my sandwich.”
You could use “pigeons” as a code. This code simply describes that the sentence involves pigeons.
So, building onto this, qualitative data coding is the process of creating and assigning codes to categorise data extracts. You’ll then use these codes later down the road to derive themes and patterns for your qualitative analysis (for example, thematic analysis ). Coding and analysis can take place simultaneously, but it’s important to note that coding does not necessarily involve identifying themes (depending on which textbook you’re reading, of course). Instead, it generally refers to the process of labelling and grouping similar types of data to make generating themes and analysing the data more manageable.
Makes sense? Great. But why should you bother with coding at all? Why not just look for themes from the outset? Well, coding is a way of making sure your data is valid . In other words, it helps ensure that your analysis is undertaken systematically and that other researchers can review it (in the world of research, we call this transparency). In other words, good coding is the foundation of high-quality analysis.

What are the different types of coding?
Now that we’ve got a plain-language definition of coding on the table, the next step is to understand what overarching types of coding exist – in other words, coding approaches . Let’s start with the two main approaches, inductive and deductive .
With deductive coding, you, as the researcher, begin with a set of pre-established codes and apply them to your data set (for example, a set of interview transcripts). Inductive coding on the other hand, works in reverse, as you create the set of codes based on the data itself – in other words, the codes emerge from the data. Let’s take a closer look at both.
Deductive coding 101
With deductive coding, we make use of pre-established codes, which are developed before you interact with the present data. This usually involves drawing up a set of codes based on a research question or previous research . You could also use a code set from the codebook of a previous study.
For example, if you were studying the eating habits of college students, you might have a research question along the lines of
“What foods do college students eat the most?”
As a result of this research question, you might develop a code set that includes codes such as “sushi”, “pizza”, and “burgers”.
Deductive coding allows you to approach your analysis with a very tightly focused lens and quickly identify relevant data . Of course, the downside is that you could miss out on some very valuable insights as a result of this tight, predetermined focus.

Inductive coding 101
But what about inductive coding? As we touched on earlier, this type of coding involves jumping right into the data and then developing the codes based on what you find within the data.
For example, if you were to analyse a set of open-ended interviews , you wouldn’t necessarily know which direction the conversation would flow. If a conversation begins with a discussion of cats, it may go on to include other animals too, and so you’d add these codes as you progress with your analysis. Simply put, with inductive coding, you “go with the flow” of the data.
Inductive coding is great when you’re researching something that isn’t yet well understood because the coding derived from the data helps you explore the subject. Therefore, this type of coding is usually used when researchers want to investigate new ideas or concepts , or when they want to create new theories.

A little bit of both… hybrid coding approaches
If you’ve got a set of codes you’ve derived from a research topic, literature review or a previous study (i.e. a deductive approach), but you still don’t have a rich enough set to capture the depth of your qualitative data, you can combine deductive and inductive methods – this is called a hybrid coding approach.
To adopt a hybrid approach, you’ll begin your analysis with a set of a priori codes (deductive) and then add new codes (inductive) as you work your way through the data. Essentially, the hybrid coding approach provides the best of both worlds, which is why it’s pretty common to see this in research.
Need a helping hand?
How to code qualitative data
Now that we’ve looked at the main approaches to coding, the next question you’re probably asking is “how do I actually do it?”. Let’s take a look at the coding process , step by step.
Both inductive and deductive methods of coding typically occur in two stages: initial coding and line by line coding .
In the initial coding stage, the objective is to get a general overview of the data by reading through and understanding it. If you’re using an inductive approach, this is also where you’ll develop an initial set of codes. Then, in the second stage (line by line coding), you’ll delve deeper into the data and (re)organise it according to (potentially new) codes.
Step 1 – Initial coding
The first step of the coding process is to identify the essence of the text and code it accordingly. While there are various qualitative analysis software packages available, you can just as easily code textual data using Microsoft Word’s “comments” feature.
Let’s take a look at a practical example of coding. Assume you had the following interview data from two interviewees:
What pets do you have?
I have an alpaca and three dogs.
Only one alpaca? They can die of loneliness if they don’t have a friend.
I didn’t know that! I’ll just have to get five more.
I have twenty-three bunnies. I initially only had two, I’m not sure what happened.
In the initial stage of coding, you could assign the code of “pets” or “animals”. These are just initial, fairly broad codes that you can (and will) develop and refine later. In the initial stage, broad, rough codes are fine – they’re just a starting point which you will build onto in the second stage.

How to decide which codes to use
But how exactly do you decide what codes to use when there are many ways to read and interpret any given sentence? Well, there are a few different approaches you can adopt. The main approaches to initial coding include:
- In vivo coding
Process coding
- Open coding
Descriptive coding
Structural coding.
- Value coding
Let’s take a look at each of these:
In vivo coding
When you use in vivo coding , you make use of a participants’ own words , rather than your interpretation of the data. In other words, you use direct quotes from participants as your codes. By doing this, you’ll avoid trying to infer meaning, rather staying as close to the original phrases and words as possible.
In vivo coding is particularly useful when your data are derived from participants who speak different languages or come from different cultures. In these cases, it’s often difficult to accurately infer meaning due to linguistic or cultural differences.
For example, English speakers typically view the future as in front of them and the past as behind them. However, this isn’t the same in all cultures. Speakers of Aymara view the past as in front of them and the future as behind them. Why? Because the future is unknown, so it must be out of sight (or behind us). They know what happened in the past, so their perspective is that it’s positioned in front of them, where they can “see” it.
In a scenario like this one, it’s not possible to derive the reason for viewing the past as in front and the future as behind without knowing the Aymara culture’s perception of time. Therefore, in vivo coding is particularly useful, as it avoids interpretation errors.
Next up, there’s process coding , which makes use of action-based codes . Action-based codes are codes that indicate a movement or procedure. These actions are often indicated by gerunds (words ending in “-ing”) – for example, running, jumping or singing.
Process coding is useful as it allows you to code parts of data that aren’t necessarily spoken, but that are still imperative to understanding the meaning of the texts.
An example here would be if a participant were to say something like, “I have no idea where she is”. A sentence like this can be interpreted in many different ways depending on the context and movements of the participant. The participant could shrug their shoulders, which would indicate that they genuinely don’t know where the girl is; however, they could also wink, showing that they do actually know where the girl is.
Simply put, process coding is useful as it allows you to, in a concise manner, identify the main occurrences in a set of data and provide a dynamic account of events. For example, you may have action codes such as, “describing a panda”, “singing a song about bananas”, or “arguing with a relative”.

Descriptive coding aims to summarise extracts by using a single word or noun that encapsulates the general idea of the data. These words will typically describe the data in a highly condensed manner, which allows the researcher to quickly refer to the content.
Descriptive coding is very useful when dealing with data that appear in forms other than traditional text – i.e. video clips, sound recordings or images. For example, a descriptive code could be “food” when coding a video clip that involves a group of people discussing what they ate throughout the day, or “cooking” when coding an image showing the steps of a recipe.
Structural coding involves labelling and describing specific structural attributes of the data. Generally, it includes coding according to answers to the questions of “ who ”, “ what ”, “ where ”, and “ how ”, rather than the actual topics expressed in the data. This type of coding is useful when you want to access segments of data quickly, and it can help tremendously when you’re dealing with large data sets.
For example, if you were coding a collection of theses or dissertations (which would be quite a large data set), structural coding could be useful as you could code according to different sections within each of these documents – i.e. according to the standard dissertation structure . What-centric labels such as “hypothesis”, “literature review”, and “methodology” would help you to efficiently refer to sections and navigate without having to work through sections of data all over again.
Structural coding is also useful for data from open-ended surveys. This data may initially be difficult to code as they lack the set structure of other forms of data (such as an interview with a strict set of questions to be answered). In this case, it would useful to code sections of data that answer certain questions such as “who?”, “what?”, “where?” and “how?”.
Let’s take a look at a practical example. If we were to send out a survey asking people about their dogs, we may end up with a (highly condensed) response such as the following:
Bella is my best friend. When I’m at home I like to sit on the floor with her and roll her ball across the carpet for her to fetch and bring back to me. I love my dog.
In this set, we could code Bella as “who”, dog as “what”, home and floor as “where”, and roll her ball as “how”.
Values coding
Finally, values coding involves coding that relates to the participant’s worldviews . Typically, this type of coding focuses on excerpts that reflect the values, attitudes, and beliefs of the participants. Values coding is therefore very useful for research exploring cultural values and intrapersonal and experiences and actions.
To recap, the aim of initial coding is to understand and familiarise yourself with your data , to develop an initial code set (if you’re taking an inductive approach) and to take the first shot at coding your data . The coding approaches above allow you to arrange your data so that it’s easier to navigate during the next stage, line by line coding (we’ll get to this soon).
While these approaches can all be used individually, it’s important to remember that it’s possible, and potentially beneficial, to combine them . For example, when conducting initial coding with interviews, you could begin by using structural coding to indicate who speaks when. Then, as a next step, you could apply descriptive coding so that you can navigate to, and between, conversation topics easily. You can check out some examples of various techniques here .
Step 2 – Line by line coding
Once you’ve got an overall idea of our data, are comfortable navigating it and have applied some initial codes, you can move on to line by line coding. Line by line coding is pretty much exactly what it sounds like – reviewing your data, line by line, digging deeper and assigning additional codes to each line.
With line-by-line coding, the objective is to pay close attention to your data to add detail to your codes. For example, if you have a discussion of beverages and you previously just coded this as “beverages”, you could now go deeper and code more specifically, such as “coffee”, “tea”, and “orange juice”. The aim here is to scratch below the surface. This is the time to get detailed and specific so as to capture as much richness from the data as possible.
In the line-by-line coding process, it’s useful to code everything in your data, even if you don’t think you’re going to use it (you may just end up needing it!). As you go through this process, your coding will become more thorough and detailed, and you’ll have a much better understanding of your data as a result of this, which will be incredibly valuable in the analysis phase.

Moving from coding to analysis
Once you’ve completed your initial coding and line by line coding, the next step is to start your analysis . Of course, the coding process itself will get you in “analysis mode” and you’ll probably already have some insights and ideas as a result of it, so you should always keep notes of your thoughts as you work through the coding.
When it comes to qualitative data analysis, there are many different types of analyses (we discuss some of the most popular ones here ) and the type of analysis you adopt will depend heavily on your research aims, objectives and questions . Therefore, we’re not going to go down that rabbit hole here, but we’ll cover the important first steps that build the bridge from qualitative data coding to qualitative analysis.
When starting to think about your analysis, it’s useful to ask yourself the following questions to get the wheels turning:
- What actions are shown in the data?
- What are the aims of these interactions and excerpts? What are the participants potentially trying to achieve?
- How do participants interpret what is happening, and how do they speak about it? What does their language reveal?
- What are the assumptions made by the participants?
- What are the participants doing? What is going on?
- Why do I want to learn about this? What am I trying to find out?
- Why did I include this particular excerpt? What does it represent and how?

Code categorisation
Categorisation is simply the process of reviewing everything you’ve coded and then creating code categories that can be used to guide your future analysis. In other words, it’s about creating categories for your code set. Let’s take a look at a practical example.
If you were discussing different types of animals, your initial codes may be “dogs”, “llamas”, and “lions”. In the process of categorisation, you could label (categorise) these three animals as “mammals”, whereas you could categorise “flies”, “crickets”, and “beetles” as “insects”. By creating these code categories, you will be making your data more organised, as well as enriching it so that you can see new connections between different groups of codes.
Theme identification
From the coding and categorisation processes, you’ll naturally start noticing themes. Therefore, the logical next step is to identify and clearly articulate the themes in your data set. When you determine themes, you’ll take what you’ve learned from the coding and categorisation and group it all together to develop themes. This is the part of the coding process where you’ll try to draw meaning from your data, and start to produce a narrative . The nature of this narrative depends on your research aims and objectives, as well as your research questions (sounds familiar?) and the qualitative data analysis method you’ve chosen, so keep these factors front of mind as you scan for themes.

Tips & tricks for quality coding
Before we wrap up, let’s quickly look at some general advice, tips and suggestions to ensure your qualitative data coding is top-notch.
- Before you begin coding, plan out the steps you will take and the coding approach and technique(s) you will follow to avoid inconsistencies.
- When adopting deductive coding, it’s useful to use a codebook from the start of the coding process. This will keep your work organised and will ensure that you don’t forget any of your codes.
- Whether you’re adopting an inductive or deductive approach, keep track of the meanings of your codes and remember to revisit these as you go along.
- Avoid using synonyms for codes that are similar, if not the same. This will allow you to have a more uniform and accurate coded dataset and will also help you to not get overwhelmed by your data.
- While coding, make sure that you remind yourself of your aims and coding method. This will help you to avoid directional drift , which happens when coding is not kept consistent.
- If you are working in a team, make sure that everyone has been trained and understands how codes need to be assigned.
32 Comments

I appreciated the valuable information provided to accomplish the various stages of the inductive and inductive coding process. However, I would have been extremely satisfied to be appraised of the SPECIFIC STEPS to follow for: 1. Deductive coding related to the phenomenon and its features to generate the codes, categories, and themes. 2. Inductive coding related to using (a) Initial (b) Axial, and (c) Thematic procedures using transcribe data from the research questions

Thank you so much for this. Very clear and simplified discussion about qualitative data coding.

This is what I want and the way I wanted it. Thank you very much.

All of the information’s are valuable and helpful. Thank for you giving helpful information’s. Can do some article about alternative methods for continue researches during the pandemics. It is more beneficial for those struggling to continue their researchers.

Thank you for your information on coding qualitative data, this is a very important point to be known, really thank you very much.

Very useful article. Clear, articulate and easy to understand. Thanks

This is very useful. You have simplified it the way I wanted it to be! Thanks

Thank you so very much for explaining, this is quite helpful!

hello, great article! well written and easy to understand. Can you provide some of the sources in this article used for further reading purposes?

You guys are doing a great job out there . I will not realize how many students you help through your articles and post on a daily basis. I have benefited a lot from your work. this is remarkable.

Wonderful one thank you so much.

Hello, I am doing qualitative research, please assist with example of coding format.

This is an invaluable website! Thank you so very much!

Well explained and easy to follow the presentation. A big thumbs up to you. Greatly appreciate the effort 👏👏👏👏

Thank you for this clear article with examples

Thank you for the detailed explanation. I appreciate your great effort. Congrats!

Ahhhhhhhhhh! You just killed me with your explanation. Crystal clear. Two Cheers!

D0 you have primary references that was used when creating this? If so, can you share them?

Being a complete novice to the field of qualitative data analysis, your indepth analysis of the process of thematic analysis has given me better insight. Thank you so much.

Excellent summary

Thank you so much for your precise and very helpful information about coding in qualitative data.

Thanks a lot to this helpful information. You cleared the fog in my brain.

Glad to hear that!

This has been very helpful. I am excited and grateful.

I still don’t understand the coding and categorizing of qualitative research, please give an example on my research base on the state of government education infrastructure environment in PNG

Wahho, this is amazing and very educational to have come across this site.. from a little search to a wide discovery of knowledge.
Thanks I really appreciate this.

Thank you so much! Very grateful.

This was truly helpful. I have been so lost, and this simplified the process for me.

Just at the right time when I needed to distinguish between inductive and
deductive data analysis of my Focus group discussion results very helpful

Very useful across disciplines and at all levels. Thanks…

Hello, Thank you for sharing your knowledge on us.
Submit a Comment Cancel reply
Your email address will not be published. Required fields are marked *
Save my name, email, and website in this browser for the next time I comment.
- Print Friendly
Chapter 18. Data Analysis and Coding
Introduction.
Piled before you lie hundreds of pages of fieldnotes you have taken, observations you’ve made while volunteering at city hall. You also have transcripts of interviews you have conducted with the mayor and city council members. What do you do with all this data? How can you use it to answer your original research question (e.g., “How do political polarization and party membership affect local politics?”)? Before you can make sense of your data, you will have to organize and simplify it in a way that allows you to access it more deeply and thoroughly. We call this process coding . [1] Coding is the iterative process of assigning meaning to the data you have collected in order to both simplify and identify patterns. This chapter introduces you to the process of qualitative data analysis and the basic concept of coding, while the following chapter (chapter 19) will take you further into the various kinds of codes and how to use them effectively.
To those who have not yet conducted a qualitative study, the sheer amount of collected data will be a surprise. Qualitative data can be absolutely overwhelming—it may mean hundreds if not thousands of pages of interview transcripts, or fieldnotes, or retrieved documents. How do you make sense of it? Students often want very clear guidelines here, and although I try to accommodate them as much as possible, in the end, analyzing qualitative data is a bit more of an art than a science: “The process of bringing order, structure, and interpretation to a mass of collected data is messy, ambiguous, time-consuming, creative, and fascinating. It does not proceed in a linear fashion: it is not neat. At times, the researcher may feel like an eccentric and tormented artist; not to worry, this is normal” ( Marshall and Rossman 2016:214 ).
To complicate matters further, each approach (e.g., Grounded Theory, deep ethnography, phenomenology) has its own language and bag of tricks (techniques) when it comes to analysis. Grounded Theory, for example, uses in vivo coding to generate new theoretical insights that emerge from a rigorous but open approach to data analysis. Ethnographers, in contrast, are more focused on creating a rich description of the practices, behaviors, and beliefs that operate in a particular field. They are less interested in generating theory and more interested in getting the picture right, valuing verisimilitude in the presentation. And then there are some researchers who seek to account for the qualitative data using almost quantitative methods of analysis, perhaps counting and comparing the uses of certain narrative frames in media accounts of a phenomenon. Qualitative content analysis (QCA) often includes elements of counting (see chapter 17). For these researchers, having very clear hypotheses and clearly defined “variables” before beginning analysis is standard practice, whereas the same would be expressly forbidden by those researchers, like grounded theorists, taking a more emergent approach.
All that said, there are some helpful techniques to get you started, and these will be presented in this and the following chapter. As you become more of an expert yourself, you may want to read more deeply about the tradition that speaks to your research. But know that there are many excellent qualitative researchers that use what works for any given study, who take what they can from each tradition. Most of us find this permissible (but watch out for the methodological purists that exist among us).

Qualitative Data Analysis as a Long Process!
Although most of this and the following chapter will focus on coding, it is important to understand that coding is just one (very important) aspect of the long data-analysis process. We can consider seven phases of data analysis, each of which is important for moving your voluminous data into “findings” that can be reported to others. The first phase involves data organization. This might mean creating a special password-protected Dropbox folder for storing your digital files. It might mean acquiring computer-assisted qualitative data-analysis software ( CAQDAS ) and uploading all transcripts, fieldnotes, and digital files to its storage repository for eventual coding and analysis. Finding a helpful way to store your material can take a lot of time, and you need to be smart about this from the very beginning. Losing data because of poor filing systems or mislabeling is something you want to avoid. You will also want to ensure that you have procedures in place to protect the confidentiality of your interviewees and informants. Filing signed consent forms (with names) separately from transcripts and linking them through an ID number or other code that only you have access to (and store safely) are important.
Once you have all of your material safely and conveniently stored, you will need to immerse yourself in the data. The second phase consists of reading and rereading or viewing and reviewing all of your data. As you do this, you can begin to identify themes or patterns in the data, perhaps writing short memos to yourself about what you are seeing. You are not committing to anything in this third phase but rather keeping your eyes and mind open to what you see. In an actual study, you may very well still be “in the field” or collecting interviews as you do this, and what you see might push you toward either concluding your data collection or expanding so that you can follow a particular group or factor that is emerging as important. For example, you may have interviewed twelve international college students about how they are adjusting to life in the US but realized as you read your transcripts that important gender differences may exist and you have only interviewed two women (and ten men). So you go back out and make sure you have enough female respondents to check your impression that gender matters here. The seven phases do not proceed entirely linearly! It is best to think of them as recursive; conceptually, there is a path to follow, but it meanders and flows.
Coding is the activity of the fourth phase . The second part of this chapter and all of chapter 19 will focus on coding in greater detail. For now, know that coding is the primary tool for analyzing qualitative data and that its purpose is to both simplify and highlight the important elements buried in mounds of data. Coding is a rigorous and systematic process of identifying meaning, patterns, and relationships. It is a more formal extension of what you, as a conscious human being, are trained to do every day when confronting new material and experiences. The “trick” or skill is to learn how to take what you do naturally and semiconsciously in your mind and put it down on paper so it can be documented and verified and tested and refined.
At the conclusion of the coding phase, your material will be searchable, intelligible, and ready for deeper analysis. You can begin to offer interpretations based on all the work you have done so far. This fifth phase might require you to write analytic memos, beginning with short (perhaps a paragraph or two) interpretations of various aspects of the data. You might then attempt stitching together both reflective and analytical memos into longer (up to five pages) general interpretations or theories about the relationships, activities, patterns you have noted as salient.
As you do this, you may be rereading the data, or parts of the data, and reviewing your codes. It’s possible you get to this phase and decide you need to go back to the beginning. Maybe your entire research question or focus has shifted based on what you are now thinking is important. Again, the process is recursive , not linear. The sixth phase requires you to check the interpretations you have generated. Are you really seeing this relationship, or are you ignoring something important you forgot to code? As we don’t have statistical tests to check the validity of our findings as quantitative researchers do, we need to incorporate self-checks on our interpretations. Ask yourself what evidence would exist to counter your interpretation and then actively look for that evidence. Later on, if someone asks you how you know you are correct in believing your interpretation, you will be able to explain what you did to verify this. Guard yourself against accusations of “ cherry-picking ,” selecting only the data that supports your preexisting notion or expectation about what you will find. [2]
The seventh and final phase involves writing up the results of the study. Qualitative results can be written in a variety of ways for various audiences (see chapter 20). Due to the particularities of qualitative research, findings do not exist independently of their being written down. This is different for quantitative research or experimental research, where completed analyses can somewhat speak for themselves. A box of collected qualitative data remains a box of collected qualitative data without its written interpretation. Qualitative research is often evaluated on the strength of its presentation. Some traditions of qualitative inquiry, such as deep ethnography, depend on written thick descriptions, without which the research is wholly incomplete, even nonexistent. All of that practice journaling and writing memos (reflective and analytical) help develop writing skills integral to the presentation of the findings.
Remember that these are seven conceptual phases that operate in roughly this order but with a lot of meandering and recursivity throughout the process. This is very different from quantitative data analysis, which is conducted fairly linearly and processually (first you state a falsifiable research question with hypotheses, then you collect your data or acquire your data set, then you analyze the data, etc.). Things are a bit messier when conducting qualitative research. Embrace the chaos and confusion, and sort your way through the maze. Budget a lot of time for this process. Your research question might change in the middle of data collection. Don’t worry about that. The key to being nimble and flexible in qualitative research is to start thinking and continue thinking about your data, even as it is being collected. All seven phases can be started before all the data has been gathered. Data collection does not always precede data analysis. In some ways, “qualitative data collection is qualitative data analysis.… By integrating data collection and data analysis, instead of breaking them up into two distinct steps, we both enrich our insights and stave off anxiety. We all know the anxiety that builds when we put something off—the longer we put it off, the more anxious we get. If we treat data collection as this mass of work we must do before we can get started on the even bigger mass of work that is analysis, we set ourselves up for massive anxiety” ( Rubin 2021:182–183 ; emphasis added).
The Coding Stage
A code is “a word or short phrase that symbolically assigns a summative, salient, essence-capturing, and/or evocative attribute for a portion of language-based or visual data” ( Saldaña 2014:5 ). Codes can be applied to particular sections of or entire transcripts, documents, or even videos. For example, one might code a video taken of a preschooler trying to solve a puzzle as “puzzle,” or one could take the transcript of that video and highlight particular sections or portions as “arranging puzzle pieces” (a descriptive code) or “frustration” (a summative emotion-based code). If the preschooler happily shouts out, “I see it!” you can denote the code “I see it!” (this is an example of an in vivo, participant-created code). As one can see from even this short example, there are many different kinds of codes and many different strategies and techniques for coding, more of which will be discussed in detail in chapter 19. The point to remember is that coding is a rigorous systematic process—to some extent, you are always coding whenever you look at a person or try to make sense of a situation or event, but you rarely do this consciously. Coding is the process of naming what you are seeing and how you are simplifying the data so that you can make sense of it in a way that is consistent with your study and in a way that others can understand and follow and replicate. Another way of saying this is that a code is “a researcher-generated interpretation that symbolizes or translates data” ( Vogt et al. 2014:13 ).
As with qualitative data analysis generally, coding is often done recursively, meaning that you do not merely take one pass through the data to create your codes. Saldaña ( 2014 ) differentiates first-cycle coding from second-cycle coding. The goal of first-cycle coding is to “tag” or identify what emerges as important codes. Note that I said emerges—you don’t always know from the beginning what will be an important aspect of the study or not, so the coding process is really the place for you to begin making the kinds of notes necessary for future analyses. In second-cycle coding, you will want to be much more focused—no longer gathering wholly new codes but synthesizing what you have into metacodes.
You might also conceive of the coding process in four parts (figure 18.1). First, identify a representative or diverse sample set of interview transcripts (or fieldnotes or other documents). This is the group you are going to use to get a sense of what might be emerging. In my own study of career obstacles to success among first-generation and working-class persons in sociology, I might select one interview from each career stage: a graduate student, a junior faculty member, a senior faculty member.
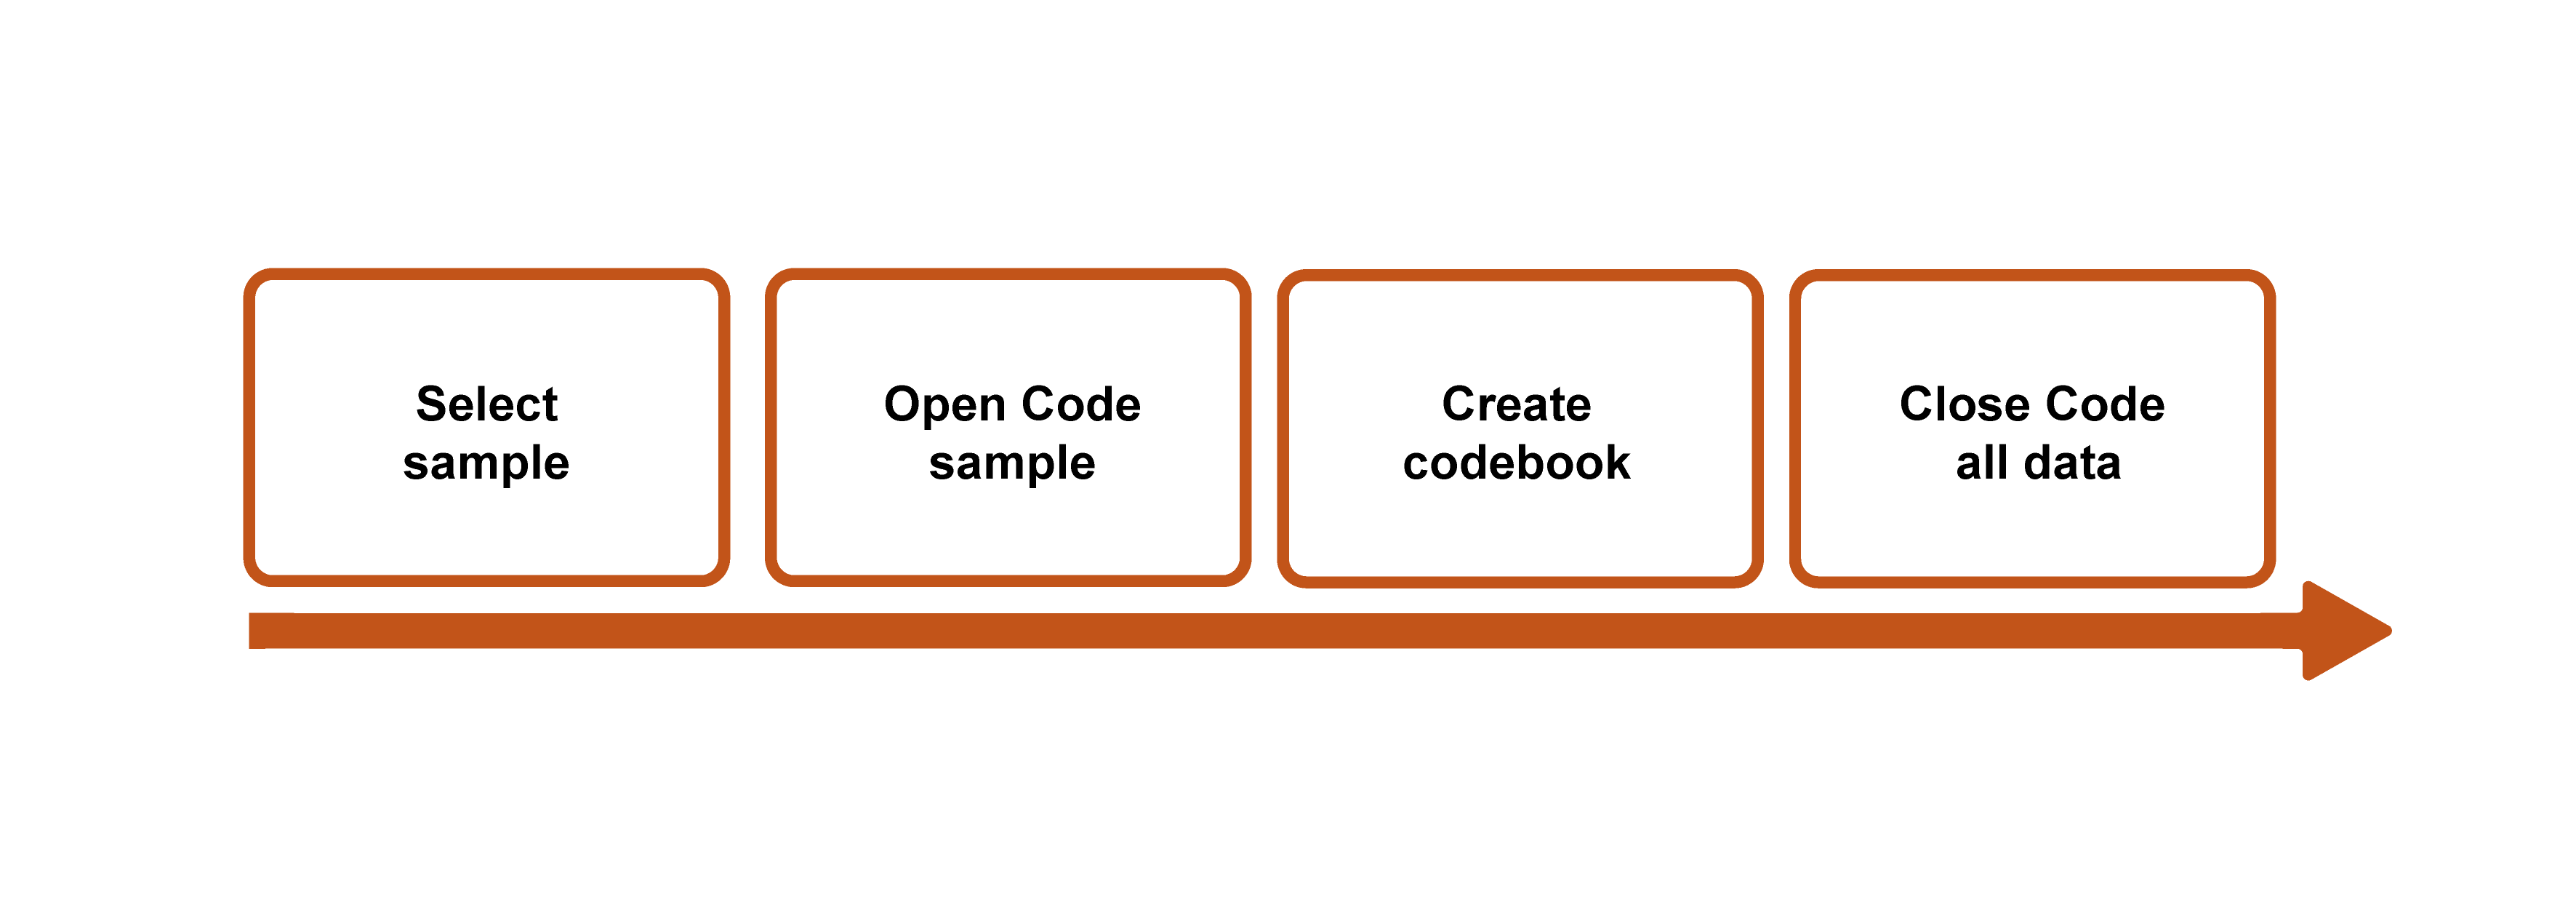
Second, code everything (“ open coding ”). See what emerges, and don’t limit yourself in any way. You will end up with a ton of codes, many more than you will end up with, but this is an excellent way to not foreclose an interesting finding too early in the analysis. Note the importance of starting with a sample of your collected data, because otherwise, open coding all your data is, frankly, impossible and counterproductive. You will just get stuck in the weeds.
Third, pare down your coding list. Where you may have begun with fifty (or more!) codes, you probably want no more than twenty remaining. Go back through the weeds and pull out everything that does not have the potential to bloom into a nicely shaped garden. Note that you should do this before tackling all of your data . Sometimes, however, you might need to rethink the sample you chose. Let’s say that the graduate student interview brought up some interesting gender issues that were pertinent to female-identifying sociologists, but both the junior and the senior faculty members identified as male. In that case, I might read through and open code at least one other interview transcript, perhaps a female-identifying senior faculty member, before paring down my list of codes.
This is also the time to create a codebook if you are using one, a master guide to the codes you are using, including examples (see Sample Codebooks 1 and 2 ). A codebook is simply a document that lists and describes the codes you are using. It is easy to forget what you meant the first time you penciled a coded notation next to a passage, so the codebook allows you to be clear and consistent with the use of your codes. There is not one correct way to create a codebook, but generally speaking, the codebook should include (1) the code (either name or identification number or both), (2) a description of what the code signifies and when and where it should be applied, and (3) an example of the code to help clarify (2). Listing all the codes down somewhere also allows you to organize and reorganize them, which can be part of the analytical process. It is possible that your twenty remaining codes can be neatly organized into five to seven master “themes.” Codebooks can and should develop as you recursively read through and code your collected material. [3]
Fourth, using the pared-down list of codes (or codebook), read through and code all the data. I know many qualitative researchers who work without a codebook, but it is still a good practice, especially for beginners. At the very least, read through your list of codes before you begin this “ closed coding ” step so that you can minimize the chance of missing a passage or section that needs to be coded. The final step is…to do it all again. Or, at least, do closed coding (step four) again. All of this takes a great deal of time, and you should plan accordingly.
Researcher Note
People often say that qualitative research takes a lot of time. Some say this because qualitative researchers often collect their own data. This part can be time consuming, but to me, it’s the analytical process that takes the most time. I usually read every transcript twice before starting to code, then it usually takes me six rounds of coding until I’m satisfied I’ve thoroughly coded everything. Even after the coding, it usually takes me a year to figure out how to put the analysis together into a coherent argument and to figure out what language to use. Just deciding what name to use for a particular group or idea can take months. Understanding this going in can be helpful so that you know to be patient with yourself.
—Jessi Streib, author of The Power of the Past and Privilege Lost
Note that there is no magic in any of this, nor is there any single “right” way to code or any “correct” codes. What you see in the data will be prompted by your position as a researcher and your scholarly interests. Where the above codes on a preschooler solving a puzzle emerged from my own interest in puzzle solving, another researcher might focus on something wholly different. A scholar of linguistics, for example, may focus instead on the verbalizations made by the child during the discovery process, perhaps even noting particular vocalizations (incidence of grrrs and gritting of the teeth, for example). Your recording of the codes you used is the important part, as it allows other researchers to assess the reliability and validity of your analyses based on those codes. Chapter 19 will provide more details about the kinds of codes you might develop.
Saldaña ( 2014 ) lists seven “necessary personal attributes” for successful coding. To paraphrase, they are the following:
- Having (or practicing) good organizational skills
- Perseverance
- The ability and willingness to deal with ambiguity
- Flexibility
- Creativity, broadly understood, which includes “the ability to think visually, to think symbolically, to think in metaphors, and to think of as many ways as possible to approach a problem” (20)
- Commitment to being rigorously ethical
- Having an extensive vocabulary [4]
Writing Analytic Memos during/after Coding
Coding the data you have collected is only one aspect of analyzing it. Too many beginners have coded their data and then wondered what to do next. Coding is meant to help organize your data so that you can see it more clearly, but it is not itself an analysis. Thinking about the data, reviewing the coded data, and bringing in the previous literature (here is where you use your literature review and theory) to help make sense of what you have collected are all important aspects of data analysis. Analytic memos are notes you write to yourself about the data. They can be short (a single page or even a paragraph) or long (several pages). These memos can themselves be the subject of subsequent analytic memoing as part of the recursive process that is qualitative data analysis.
Short analytic memos are written about impressions you have about the data, what is emerging, and what might be of interest later on. You can write a short memo about a particular code, for example, and why this code seems important and where it might connect to previous literature. For example, I might write a paragraph about a “cultural capital” code that I use whenever a working-class sociologist says anything about “not fitting in” with their peers (e.g., not having the right accent or hairstyle or private school background). I could then write a little bit about Bourdieu, who originated the notion of cultural capital, and try to make some connections between his definition and how I am applying it here. I can also use the memo to raise questions or doubts I have about what I am seeing (e.g., Maybe the type of school belongs somewhere else? Is this really the right code?). Later on, I can incorporate some of this writing into the theory section of my final paper or article. Here are some types of things that might form the basis of a short memo: something you want to remember, something you noticed that was new or different, a reaction you had, a suspicion or hunch that you are developing, a pattern you are noticing, any inferences you are starting to draw. Rubin ( 2021 ) advises, “Always include some quotation or excerpt from your dataset…that set you off on this idea. It’s happened to me so many times—I’ll have a really strong reaction to a piece of data, write down some insight without the original quotation or context, and then [later] have no idea what I was talking about and have no way of recreating my insight because I can’t remember what piece of data made me think this way” ( 203 ).
All CAQDAS programs include spaces for writing, generating, and storing memos. You can link a memo to a particular transcript, for example. But you can just as easily keep a notebook at hand in which you write notes to yourself, if you prefer the more tactile approach. Drawing pictures that illustrate themes and patterns you are beginning to see also works. The point is to write early and write often, as these memos are the building blocks of your eventual final product (chapter 20).
In the next chapter (chapter 19), we will go a little deeper into codes and how to use them to identify patterns and themes in your data. This chapter has given you an idea of the process of data analysis, but there is much yet to learn about the elements of that process!
Qualitative Data-Analysis Samples
The following three passages are examples of how qualitative researchers describe their data-analysis practices. The first, by Harvey, is a useful example of how data analysis can shift the original research questions. The second example, by Thai, shows multiple stages of coding and how these stages build upward to conceptual themes and theorization. The third example, by Lamont, shows a masterful use of a variety of techniques to generate theory.
Example 1: “Look Someone in the Eye” by Peter Francis Harvey ( 2022 )
I entered the field intending to study gender socialization. However, through the iterative process of writing fieldnotes, rereading them, conducting further research, and writing extensive analytic memos, my focus shifted. Abductive analysis encourages the search for unexpected findings in light of existing literature. In my early data collection, fieldnotes, and memoing, classed comportment was unmistakably prominent in both schools. I was surprised by how pervasive this bodily socialization proved to be and further surprised by the discrepancies between the two schools.…I returned to the literature to compare my empirical findings.…To further clarify patterns within my data and to aid the search for disconfirming evidence, I constructed data matrices (Miles, Huberman, and Saldaña 2013). While rereading my fieldnotes, I used ATLAS.ti to code and recode key sections (Miles et al. 2013), punctuating this process with additional analytic memos. ( 2022:1420 )
Example 2:” Policing and Symbolic Control” by Mai Thai ( 2022 )
Conventional to qualitative research, my analyses iterated between theory development and testing. Analytical memos were written throughout the data collection, and my analyses using MAXQDA software helped me develop, confirm, and challenge specific themes.…My early coding scheme which included descriptive codes (e.g., uniform inspection, college trips) and verbatim codes of the common terms used by field site participants (e.g., “never quit,” “ghetto”) led me to conceptualize valorization. Later analyses developed into thematic codes (e.g., good citizens, criminality) and process codes (e.g., valorization, criminalization), which helped refine my arguments. ( 2022:1191–1192 )
Example 3: The Dignity of Working Men by Michèle Lamont ( 2000 )
To analyze the interviews, I summarized them in a 13-page document including socio-demographic information as well as information on the boundary work of the interviewees. To facilitate comparisons, I noted some of the respondents’ answers on grids and summarized these on matrix displays using techniques suggested by Miles and Huberman for standardizing and processing qualitative data. Interviews were also analyzed one by one, with a focus on the criteria that each respondent mobilized for the evaluation of status. Moreover, I located each interviewee on several five-point scales pertaining to the most significant dimensions they used to evaluate status. I also compared individual interviewees with respondents who were similar to and different from them, both within and across samples. Finally, I classified all the transcripts thematically to perform a systematic analysis of all the important themes that appear in the interviews, approaching the latter as data against which theoretical questions can be explored. ( 2000:256–257 )
Sample Codebook 1
This is an abridged version of the codebook used to analyze qualitative responses to a question about how class affects careers in sociology. Note the use of numbers to organize the flow, supplemented by highlighting techniques (e.g., bolding) and subcoding numbers.
01. CAPS: Any reference to “capitals” in the response, even if the specific words are not used
01.1: cultural capital 01.2: social capital 01.3: economic capital
(can be mixed: “0.12”= both cultural and asocial capital; “0.23”= both social and economic)
01. CAPS: a reference to “capitals” in which the specific words are used [ bold : thus, 01.23 means that both social capital and economic capital were mentioned specifically
02. DEBT: discussion of debt
02.1: mentions personal issues around debt 02.2: discusses debt but in the abstract only (e.g., “people with debt have to worry”)
03. FirstP: how the response is positioned
03.1: neutral or abstract response 03.2: discusses self (“I”) 03.3: discusses others (“they”)
Sample Coded Passage:
| “I was really hurt when I didn’t get that scholarship. It was going to cost me thousands of dollars to stay in the program, and I was going to have to borrow all of it. My faculty advisor wasn’t helpful at all. They told | 03.2 |
| me not to worry about it, because it wasn’t really that much money! I almost fell over when they said that! Like, do they not understand what it’s like to be poor? I just felt so isolated then. I was on my own. | 02.1. 01.3 |
| I couldn’t talk to anyone about it, because no one else seemed to worry about it. Talk about economic capital!” |
* Question: What other codes jump out to you here? Shouldn’t there be a code for feelings of loneliness or alienation? What about an emotions code ?
Sample Codebook 2
| CODE | DEFINITION | WHEN TO APPLY | IN VIVO EXAMPLE |
|---|---|---|---|
| ALIENATION | Feeling out of place in academia | Any time uses the word alienation or impostor syndrome or feeling out of place | “I was so lonely in graduate school. It was an alienating experience.” |
| CULTURAL CAPITAL | Knowledge or other cultural resources that affect success in academia | When “cultural capital” is used but also when knowledge or lack of knowledge about cultural things are discussed | “We went to a fancy restaurant after my job interview and I was paralyzed with fear because I did not know which fork I was supposed to be using. Yikes!” |
| SOCIAL CAPITAL | Social networks that advance success in academia | When “social capital” is used but also when social networks are discussed or knowing the right people | “I didn’t know who to turn to. It seemed like everyone else had parents who could help them and I didn’t know anyone else who had ever even gone to college!” |
This is an example that uses "word" categories only, with descriptions and examples for each code
Further Readings
Elliott, Victoria. 2018. “Thinking about the Coding Process in Qualitative Analysis.” Qualitative Report 23(11):2850–2861. Address common questions those new to coding ask, including the use of “counting” and how to shore up reliability.
Friese, Susanne. 2019. Qualitative Data Analysis with ATLAS.ti. 3rd ed. A good guide to ATLAS.ti, arguably the most used CAQDAS program. Organized around a series of “skills training” to get you up to speed.
Jackson, Kristi, and Pat Bazeley. 2019. Qualitative Data Analysis with NVIVO . 3rd ed. Thousand Oaks, CA: SAGE. If you want to use the CAQDAS program NVivo, this is a good affordable guide to doing so. Includes copious examples, figures, and graphic displays.
LeCompte, Margaret D. 2000. “Analyzing Qualitative Data.” Theory into Practice 39(3):146–154. A very practical and readable guide to the entire coding process, with particular applicability to educational program evaluation/policy analysis.
Miles, Matthew B., and A. Michael Huberman. 1994. Qualitative Data Analysis: An Expanded Sourcebook . 2nd ed. Thousand Oaks, CA: SAGE. A classic reference on coding. May now be superseded by Miles, Huberman, and Saldaña (2019).
Miles, Matthew B., A. Michael Huberman, and Johnny Saldaña. 2019. Qualitative Data Analysis: A Methods Sourcebook . 4th ed. Thousand Oaks, CA; SAGE. A practical methods sourcebook for all qualitative researchers at all levels using visual displays and examples. Highly recommended.
Saldaña, Johnny. 2014. The Coding Manual for Qualitative Researchers . 2nd ed. Thousand Oaks, CA: SAGE. The most complete and comprehensive compendium of coding techniques out there. Essential reference.
Silver, Christina. 2014. Using Software in Qualitative Research: A Step-by-Step Guide. 2nd ed. Thousand Oaks, CA; SAGE. If you are unsure which CAQDAS program you are interested in using or want to compare the features and usages of each, this guidebook is quite helpful.
Vogt, W. Paul, Elaine R. Vogt, Diane C. Gardner, and Lynne M. Haeffele2014. Selecting the Right Analyses for Your Data: Quantitative, Qualitative, and Mixed Methods . New York: The Guilford Press. User-friendly reference guide to all forms of analysis; may be particularly helpful for those engaged in mixed-methods research.
- When you have collected content (historical, media, archival) that interests you because of its communicative aspect, content analysis (chapter 17) is appropriate. Whereas content analysis is both a research method and a tool of analysis, coding is a tool of analysis that can be used for all kinds of data to address any number of questions. Content analysis itself includes coding. ↵
- Scientific research, whether quantitative or qualitative, demands we keep an open mind as we conduct our research, that we are “neutral” regarding what is actually there to find. Students who are trained in non-research-based disciplines such as the arts or philosophy or who are (admirably) focused on pursuing social justice can too easily fall into the trap of thinking their job is to “demonstrate” something through the data. That is not the job of a researcher. The job of a researcher is to present (and interpret) findings—things “out there” (even if inside other people’s hearts and minds). One helpful suggestion: when formulating your research question, if you already know the answer (or think you do), scrap that research. Ask a question to which you do not yet know the answer. ↵
- Codebooks are particularly useful for collaborative research so that codes are applied and interpreted similarly. If you are working with a team of researchers, you will want to take extra care that your codebooks remain in synch and that any refinements or developments are shared with fellow coders. You will also want to conduct an “intercoder reliability” check, testing whether the codes you have developed are clearly identifiable so that multiple coders are using them similarly. Messy, unclear codes that can be interpreted differently by different coders will make it much more difficult to identify patterns across the data. ↵
- Note that this is important for creating/denoting new codes. The vocabulary does not need to be in English or any particular language. You can use whatever words or phrases capture what it is you are seeing in the data. ↵
A first-cycle coding process in which gerunds are used to identify conceptual actions, often for the purpose of tracing change and development over time. Widely used in the Grounded Theory approach.
A first-cycle coding process in which terms or phrases used by the participants become the code applied to a particular passage. It is also known as “verbatim coding,” “indigenous coding,” “natural coding,” “emic coding,” and “inductive coding,” depending on the tradition of inquiry of the researcher. It is common in Grounded Theory approaches and has even given its name to one of the primary CAQDAS programs (“NVivo”).
Computer-assisted qualitative data-analysis software. These are software packages that can serve as a repository for qualitative data and that enable coding, memoing, and other tools of data analysis. See chapter 17 for particular recommendations.
The purposeful selection of some data to prove a preexisting expectation or desired point of the researcher where other data exists that would contradict the interpretation offered. Note that it is not cherry picking to select a quote that typifies the main finding of a study, although it would be cherry picking to select a quote that is atypical of a body of interviews and then present it as if it is typical.
A preliminary stage of coding in which the researcher notes particular aspects of interest in the data set and begins creating codes. Later stages of coding refine these preliminary codes. Note: in Grounded Theory , open coding has a more specific meaning and is often called initial coding : data are broken down into substantive codes in a line-by-line manner, and incidents are compared with one another for similarities and differences until the core category is found. See also closed coding .
A set of codes, definitions, and examples used as a guide to help analyze interview data. Codebooks are particularly helpful and necessary when research analysis is shared among members of a research team, as codebooks allow for standardization of shared meanings and code attributions.
The final stages of coding after the refinement of codes has created a complete list or codebook in which all the data is coded using this refined list or codebook. Compare to open coding .
A first-cycle coding process in which emotions and emotionally salient passages are tagged.
Introduction to Qualitative Research Methods Copyright © 2023 by Allison Hurst is licensed under a Creative Commons Attribution-ShareAlike 4.0 International License , except where otherwise noted.
- AI & NLP
- Churn & Loyalty
- Customer Experience
- Customer Journeys
- Customer Metrics
- Feedback Analysis
- Product Experience
- Product Updates
- Sentiment Analysis
- Surveys & Feedback Collection
- Text Analytics
- Try Thematic
Welcome to the community

Coding Qualitative Data: How To Guide
How many hours have you spent sitting in front of Excel spreadsheets trying to find new insights from customer feedback?
You know that asking open-ended survey questions gives you more actionable insights than asking your customers for just a numerical Net Promoter Score (NPS) . But when you ask open-ended, free-text questions, you end up with hundreds (or even thousands) of free-text responses.
How can you turn all of that text into quantifiable, applicable information about your customers’ needs and expectations? By coding qualitative data.
In this article, we will cover different coding methods for qualitative data, including both manual and automated approaches, to provide a comprehensive understanding of the techniques used in the first-round pass at coding.
Keep reading to learn:
- What coding qualitative data means (and why it’s important)
- Different methods of coding qualitative data
- How to manually code qualitative data to find significant themes in your data
What is coding in qualitative research?
Conducting qualitative research, particularly through coding, is a crucial step in ensuring the validity and reliability of the findings. Coding is the process of labeling and organizing your qualitative data to identify different themes and the relationships between them.
When coding customer feedback , you assign labels to words or phrases that represent important (and recurring) themes in each response. These labels can be words, phrases, or numbers; we recommend using words or short phrases, since they’re easier to remember, skim, and organize.
Coding qualitative research to find common themes and concepts is part of thematic analysis . Thematic analysis extracts themes from text by analyzing the word and sentence structure.
Within the context of customer feedback, it’s important to understand the many different types of qualitative feedback a business can collect, such as open-ended surveys, social media comments, reviews & more.
What is qualitative data analysis?
Qualitative data analysis , including coding and analyzing qualitative data, is essential for understanding the depth and complexity of qualitative data. It is the process of examining and interpreting qualitative data to understand what it represents.
Qualitative analysis is crucial as it involves various methods such as thematic analysis, emotion coding, inductive and deductive thematic analysis, and content analysis. These methods help in coding the data, which is vital for the validity of the analysis.
Qualitative data is defined as any non-numerical and unstructured data; when looking at customer feedback, qualitative data usually refers to any verbatim or text-based feedback such as reviews, open-ended responses in surveys , complaints, chat messages, customer interviews, case notes or social media posts.
For example, NPS metric can be strictly quantitative, but when you ask customers why they gave you a rating a score, you will need qualitative data analysis methods in place to understand the comments that customers leave alongside numerical responses.
Methods of qualitative data analysis
Thematic analysis.
This refers to the uncovering of themes, by analyzing the patterns and relationships in a set of qualitative data. A theme emerges or is built when related findings appear to be meaningful and there are multiple occurrences. Thematic analysis can be used by anyone to transform and organize open-ended responses, analyze online reviews , and other qualitative data into significant themes. Thematic analysis coding is a method that aids in categorizing data extracts and deriving themes and patterns for qualitative analysis, facilitating the identification of themes revolving around a particular concept or phenomenon in the social sciences.
Content analysis:
This refers to the categorization, tagging and thematic analysis of qualitative data. Essentially content analysis is a quantification of themes, by counting the occurrence of concepts, topics or themes. Content analysis can involve combining the categories in qualitative data with quantitative data, such as behavioral data or demographic data, for deeper insights.
Narrative analysis:
Some qualitative data, such as interviews or field notes may contain a story on how someone experienced something. For example, the process of choosing a product, using it, evaluating its quality and decision to buy or not buy this product next time. The goal of narrative analysis is to turn the individual narratives into data that can be coded. This is then analyzed to understand how events or experiences had an impact on the people involved. Process coding is particularly useful in narrative analysis for identifying specific phases, sequences, and movements within the stories, capturing actions within qualitative data by using codes that typically represent gerunds ending in 'ing', providing a dynamic account of events within the data.
Discourse analysis:
This refers to analysis of what people say in social and cultural context. The goal of discourse analysis is to understand user or customer behavior by uncovering their beliefs, interests and agendas. These are reflected in the way they express their opinions, preferences and experiences. Structural coding is a method that can be applied here, organizing data based on predetermined structures, such as the structure of discourse elements, to enhance the analysis of discourse. It’s particularly useful when your focus is on building or strengthening a brand , by examining how they use metaphors and rhetorical devices.
Framework analysis:
When performing qualitative data analysis, it is useful to have a framework to organize the buckets of meaning. A taxonomy or code frame (a hierarchical set of themes used in coding qualitative data) is an example of the result. Don't fall into the trap of starting with a framework to make it faster to organize your data. You should look at how themes relate to each other by analyzing the data and consistently check that you can validate that themes are related to each other .
Grounded theory:
This method of analysis starts by formulating a theory around a single data case. Therefore the theory is “grounded' in actual data. Then additional cases can be examined to see if they are relevant and can add to the original theory.
Why is it important to code qualitative data?
Coding qualitative data makes it easier to interpret customer feedback. Assigning codes to words and phrases in each response helps capture what the response is about which, in turn, helps you better analyze and summarize the results of the entire survey.
Researchers use coding and other qualitative data analysis processes to help them make data-driven decisions based on customer feedback. When you use coding to analyze your customer feedback, you can quantify the common themes in customer language. This makes it easier to accurately interpret and analyze customer satisfaction.
What is thematic coding?
Thematic coding, also called thematic analysis, is a type of qualitative data analysis that finds themes in text by analyzing the meaning of words and sentence structure.
When you use thematic coding to analyze customer feedback for example, you can learn which themes are most frequent in feedback. This helps you understand what drives customer satisfaction in an accurate, actionable way.
To learn more about how Thematic analysis software helps you automate the data coding process, check out this article .
Automated vs. Manual coding of qualitative data
Methods of coding qualitative data fall into three categories: automated coding and manual coding, and a blend of the two.
You can automate the coding of your qualitative data with thematic analysis software . Thematic analysis and qualitative data analysis software use machine learning, artificial intelligence (AI) natural language processing (NLP) to code your qualitative data and break text up into themes.
Thematic analysis software is autonomous , which means…
- You don't need to set up themes or categories in advance.
- You don't need to train the algorithm — it learns on its own.
- You can easily capture the “unknown unknowns” to identify themes you may not have spotted on your own.
…all of which will save you time (and lots of unnecessary headaches) when analyzing your customer feedback.
Businesses are also seeing the benefit of using thematic analysis software. The capacity to aggregate data sources into a single source of analysis helps to break down data silos, unifying the analysis and insights across departments . This is now being referred to as Omni channel analysis or Unified Data Analytics .
Use Thematic Analysis Software
Try Thematic today to discover why leading companies rely on the platform to automate the coding of qualitative customer feedback at scale. Whether you have tons of customer reviews, support chat, customer service conversationals ( conversational analytics ) or open-ended survey responses, Thematic brings every valuable insight to the surface, while saving you thousands of hours.
Advances in natural language processing & machine learning have made it possible to automate the analysis of qualitative data, in particular content and framework analysis. The most commonly used software for automated coding of qualitative data is text analytics software such as Thematic .
While manual human analysis is still popular due to its perceived high accuracy, automating most of the analysis is quickly becoming the preferred choice. Unlike manual analysis, which is prone to bias and doesn't scale to the amount of qualitative data that is generated today, automating analysis is not only more consistent and therefore can be more accurate, but can also save a ton of time, and therefore money.
Our Theme Editor tool ensures you take a reflexive approach, an important step in thematic analysis. The drag-and-drop tool makes it easy to refine, validate, and rename themes as you get more data. By guiding the AI, you can ensure your results are always precise, easy to understand and perfectly aligned with your objectives.
Thematic is the best software to automate code qualitative feedback at scale.
Don't just take it from us. Here's what some of our customers have to say:
I'm a fan of Thematic's ability to save time and create heroes. It does an excellent job using a single view to break down the verbatims into themes displayed by volume, sentiment and impact on our beacon metric, often but not exclusively NPS.
It does a superlative job using GenAI in summarizing a theme or sub-theme down to a single paragraph making it clear what folks are trying to say. Peter K, Snr Research Manager.
Thematic is a very intuitive tool to use. It boasts a robust level of granularity, allowing the user to see the general breadth of verbatim themes, dig into the sub-themes, and further into the sentiment of the open text itself. Artem C, Sr Manager of Research. LinkedIn.
AI-powered software to transform qualitative data at scale through a thematic and content analysis.
How to manually code qualitative data
For the rest of this post, we'll focus on manual coding. Different researchers have different processes, but manual coding usually looks something like this:
- Choose whether you'll use deductive or inductive coding.
- Read through your data to get a sense of what it looks like. Assign your first set of codes.
- Go through your data line-by-line to code as much as possible. Your codes should become more detailed at this step.
- Categorize your codes and figure out how they fit into your coding frame.
- Identify which themes come up the most — and act on them.
Let's break it down a little further…
Deductive coding vs. inductive coding
Before you start qualitative data coding, you need to decide which codes you'll use.
What is Deductive Coding?
Deductive coding means you start with a predefined set of codes, then assign those codes to the new qualitative data. These codes might come from previous research, or you might already know what themes you're interested in analyzing. Deductive coding is also called concept-driven coding.
For example, let's say you're conducting a survey on customer experience . You want to understand the problems that arise from long call wait times, so you choose to make “wait time” one of your codes before you start looking at the data.
The deductive approach can save time and help guarantee that your areas of interest are coded. But you also need to be careful of bias; when you start with predefined codes, you have a bias as to what the answers will be. Make sure you don't miss other important themes by focusing too hard on proving your own hypothesis.
What is Inductive Coding?
Inductive coding , also called open coding, starts from scratch and creates codes based on the qualitative data itself. You don't have a set codebook; all codes arise directly from the survey responses.
Here's how inductive coding works:
- Break your qualitative dataset into smaller samples.
- Read a sample of the data.
- Create codes that will cover the sample.
- Reread the sample and apply the codes.
- Read a new sample of data, applying the codes you created for the first sample.
- Note where codes don't match or where you need additional codes.
- Create new codes based on the second sample.
- Go back and recode all responses again.
- Repeat from step 5 until you've coded all of your data.
If you add a new code, split an existing code into two, or change the description of a code, make sure to review how this change will affect the coding of all responses. Otherwise, the same responses at different points in the survey could end up with different codes.
Sounds like a lot of work, right? Inductive coding is an iterative process, which means it takes longer and is more thorough than deductive coding. A major advantage is that it gives you a more complete, unbiased look at the themes throughout your data.
Combining inductive and deductive coding
In practice, most researchers use a blend of inductive and deductive approaches to coding.
For example, with Thematic, the AI inductively comes up with themes , while also framing the analysis so that it reflects how business decisions are made . At the end of the analysis, researchers use the Theme Editor to iterate or refine themes. Then, in the next wave of analysis, as new data comes in, the AI starts deductively with the theme taxonomy.
Categorize your codes with coding frames
Once you create your codes, you need to put them into a coding frame. A coding frame represents the organizational structure of the themes in your research. There are two types of coding frames: flat and hierarchical.
Flat Coding Frame
A flat coding frame assigns the same level of specificity and importance to each code. While this might feel like an easier and faster method for manual coding, it can be difficult to organize and navigate the themes and concepts as you create more and more codes. It also makes it hard to figure out which themes are most important, which can slow down decision making.
Hierarchical Coding Frame
Hierarchical frames help you organize codes based on how they relate to one another. For example, you can organize the codes based on your customers' feelings on a certain topic:

Hierarchical Coding Frame example
In this example:
- The top-level code describes the topic (customer service)
- The mid-level code specifies whether the sentiment is positive or negative
- The third level details the attribute or specific theme associated with the topic
Hierarchical framing supports a larger code frame and lets you organize codes based on organizational structure. It also allows for different levels of granularity in your coding.
Whether your code frames are hierarchical or flat, your code frames should be flexible. Manually analyzing survey data takes a lot of time and effort; make sure you can use your results in different contexts.
For example, if your survey asks customers about customer service, you might only use codes that capture answers about customer service. Then you realize that the same survey responses have a lot of comments about your company's products. To learn more about what people say about your products, you may have to code all of the responses from scratch! A flexible coding frame covers different topics and insights, which lets you reuse the results later on.
Tips for manually coding qualitative data
Now that you know the basics of coding your qualitative data, here are some tips on making the most of your qualitative research.
Use a codebook to keep track of your codes
As you code more and more data, it can be hard to remember all of your codes off the top of your head. Tracking your codes in a codebook helps keep you organized throughout the data analysis process. Your codebook can be as simple as an Excel spreadsheet or word processor document. As you code new data, add new codes to your codebook and reorganize categories and themes as needed.
Make sure to track:
- The label used for each code
- A description of the concept or theme the code refers to
- Who originally coded it
- The date that it was originally coded or updated
- Any notes on how the code relates to other codes in your analysis
How to create high-quality codes - 4 tips
1. cover as many survey responses as possible..
The code should be generic enough to apply to multiple comments, but specific enough to be useful in your analysis. For example, “Product” is a broad code that will cover a variety of responses — but it's also pretty vague. What about the product? On the other hand, “Product stops working after using it for 3 hours” is very specific and probably won't apply to many responses. “Poor product quality” or “short product lifespan” might be a happy medium.
2. Avoid commonalities.
Having similar codes is okay as long as they serve different purposes. “Customer service” and “Product” are different enough from one another, while “Customer service” and “Customer support” may have subtle differences but should likely be combined into one code.
3. Capture the positive and the negative.
Try to create codes that contrast with each other to track both the positive and negative elements of a topic separately. For example, “Useful product features” and “Unnecessary product features” would be two different codes to capture two different themes.
4. Reduce data — to a point.
Let's look at the two extremes: There are as many codes as there are responses, or each code applies to every single response. In both cases, the coding exercise is pointless; you don't learn anything new about your data or your customers. To make your analysis as useful as possible, try to find a balance between having too many and too few codes.
Group responses based on themes, not words
Make sure to group responses with the same themes under the same code, even if they don't use the same exact wording. For example, a code such as “cleanliness” could cover responses including words and phrases like:
- Looked like a dump
- Could eat off the floor
Having only a few codes and hierarchical framing makes it easier to group different words and phrases under one code. If you have too many codes, especially in a flat frame, your results can become ambiguous and themes can overlap. Manual coding also requires the coder to remember or be able to find all of the relevant codes; the more codes you have, the harder it is to find the ones you need, no matter how organized your codebook is.
Make accuracy a priority
Manually coding qualitative data means that the coder's cognitive biases can influence the coding process. For each study, make sure you have coding guidelines and training in place to keep coding reliable, consistent, and accurate .
One thing to watch out for is definitional drift, which occurs when the data at the beginning of the data set is coded differently than the material coded later. Check for definitional drift across the entire dataset and keep notes with descriptions of how the codes vary across the results.
If you have multiple coders working on one team, have them check one another's coding to help eliminate cognitive biases.
Conclusion: 6 main takeaways for coding qualitative data
Here are 6 final takeaways for manually coding your qualitative data:
- Coding is the process of labeling and organizing your qualitative data to identify themes. After you code your qualitative data, you can analyze it just like numerical data.
- Inductive coding (without a predefined code frame) is more difficult, but less prone to bias, than deductive coding.
- Code frames can be flat (easier and faster to use) or hierarchical (more powerful and organized).
- Your code frames need to be flexible enough that you can make the most of your results and use them in different contexts.
- When creating codes, make sure they cover several responses, contrast one another, and strike a balance between too much and too little information.
- Consistent coding = accuracy. Establish coding procedures and guidelines and keep an eye out for definitional drift in your qualitative data analysis.
Some more detail in our downloadable guide
If you've made it this far, you'll likely be interested in our free guide: Best practices for analyzing open-ended questions.
The guide includes some of the topics covered in this article, and goes into some more niche details.
If your company is looking to automate your qualitative coding process, try Thematic !
If you're looking to trial multiple solutions, check out our free buyer's guide . It covers what to look for when trialing different feedback analytics solutions to ensure you get the depth of insights you need.
Happy coding!
Authored by Alyona Medelyan, PhD – Natural Language Processing & Machine Learning

CEO and Co-Founder
Alyona has a PhD in NLP and Machine Learning. Her peer-reviewed articles have been cited by over 2600 academics. Her love of writing comes from years of PhD research.
We make it easy to discover the customer and product issues that matter.
Unlock the value of feedback at scale, in one platform. Try it for free now!
- Questions to ask your Feedback Analytics vendor
- How to end customer churn for good
- Scalable analysis of NPS verbatims
- 5 Text analytics approaches
- How to calculate the ROI of CX
Our experts will show you how Thematic works, how to discover pain points and track the ROI of decisions. To access your free trial, book a personal demo today.
Recent posts
Become a qualitative theming pro! Creating a perfect code frame is hard, but thematic analysis software makes the process much easier.
Discover the power of thematic analysis to unlock insights from qualitative data. Learn about manual vs. AI-powered approaches, best practices, and how Thematic software can revolutionize your analysis workflow.
When two major storms wreaked havoc on Auckland and Watercare’s infrastructurem the utility went through a CX crisis. With a massive influx of calls to their support center, Thematic helped them get inisghts from this data to forge a new approach to restore services and satisfaction levels.
A guide to coding qualitative research data
Last updated
12 February 2023
Reviewed by
Short on time? Get an AI generated summary of this article instead
Each time you ask open-ended and free-text questions, you'll end up with numerous free-text responses. When your qualitative data piles up, how do you sift through it to determine what customers value? And how do you turn all the gathered texts into quantifiable and actionable information related to your user's expectations and needs?
Qualitative data can offer significant insights into respondents’ attitudes and behavior. But to distill large volumes of text / conversational data into clear and insightful results can be daunting. One way to resolve this is through qualitative research coding.
Streamline data coding
Use global data tagging systems in Dovetail so everyone analyzing research is speaking the same language
- What is coding in qualitative research?
This is the system of classifying and arranging qualitative data . Coding in qualitative research involves separating a phrase or word and tagging it with a code. The code describes a data group and separates the information into defined categories or themes. Using this system, researchers can find and sort related content.
They can also combine categorized data with other coded data sets for analysis, or analyze it separately. The primary goal of coding qualitative data is to change data into a consistent format in support of research and reporting.
A code can be a phrase or a word that depicts an idea or recurring theme in the data. The code’s label must be intuitive and encapsulate the essence of the researcher's observations or participants' responses. You can generate these codes using two approaches to coding qualitative data: manual coding and automated coding.
- Why is it important to code qualitative data?
By coding qualitative data, it's easier to identify consistency and scale within a set of individual responses. Assigning codes to phrases and words within feedback helps capture what the feedback entails. That way, you can better analyze and understand the outcome of the entire survey.
Researchers use coding and other qualitative data analysis procedures to make data-driven decisions according to customer responses. Coding in customer feedback will help you assess natural themes in the customers’ language. With this, it's easy to interpret and analyze customer satisfaction .
- How do inductive and deductive approaches to qualitative coding work?
Before you start qualitative research coding, you must decide whether you're starting with some predefined code frames, within which the data will be sorted (deductive approach). Or, you may plan to develop and evolve the codes while reviewing the qualitative data generated by the research (inductive approach). A combination of both approaches is also possible.
In most instances, a combined approach will be best. For example, researchers will have some predefined codes/themes they expect to find in the data, but will allow for a degree of discovery in the data where new themes and codes come to light.
Inductive coding
This is an exploratory method in which new data codes and themes are generated by the review of qualitative data. It initiates and generates code according to the source of the data itself. It's ideal for investigative research, in which you devise a new idea, theory, or concept.
Inductive coding is otherwise called open coding. There's no predefined code-frame within inductive coding, as all codes are generated by reviewing the raw qualitative data.
If you're adding a new code, changing a code descriptor, or dividing an existing code in half, ensure you review the wider code frame to determine whether this alteration will impact other feedback codes. Failure to do this may lead to similar responses at various points in the qualitative data, generating different codes while containing similar themes or insights.
Inductive coding is more thorough and takes longer than deductive coding, but offers a more unbiased and comprehensive overview of the themes within your data.
Deductive coding
This is a hierarchical approach to coding. In this method, you develop a codebook using your initial code frames. These frames may depend on an ongoing research theory or questions. Go over the data once again and filter data to different codes.
After generating your qualitative data, your codes must be a match for the code frame you began with. Program evaluation research could use this coding approach.
Inductive and deductive approaches
Research studies usually blend both inductive and deductive coding approaches. For instance, you may use a deductive approach for your initial set of code sets, and later use an inductive approach to generate fresh codes and recalibrate them while you review and analyze your data.
- What are the practical steps for coding qualitative data?
You can code qualitative data in the following ways:
1. Conduct your first-round pass at coding qualitative data
You need to review your data and assign codes to different pieces in this step. You don't have to generate the right codes since you will iterate and evolve them ahead of the second-round coding review.
Let's look at examples of the coding methods you may use in this step.
Open coding : This involves the distilling down of qualitative data into separate, distinct coded elements.
Descriptive coding : In this method, you create a description that encapsulates the data section’s content. Your code name must be a noun or a term that describes what the qualitative data relates to.
Values coding : This technique categorizes qualitative data that relates to the participant's attitudes, beliefs, and values.
Simultaneous coding : You can apply several codes to a single piece of qualitative data using this approach.
Structural coding : In this method, you can classify different parts of your qualitative data based on a predetermined design to perform additional analysis within the design.
In Vivo coding : Use this as the initial code to represent specific phrases or single words generated via a qualitative interview (i.e., specifically what the respondent said).
Process coding : A process of coding which captures action within data. Usually, this will be in the form of gerunds ending in “ing” (e.g., running, searching, reviewing).
2. Arrange your qualitative codes into groups and subcodes
You can start organizing codes into groups once you've completed your initial round of qualitative data coding. There are several ways to arrange these groups.
You can put together codes related to one another or address the same subjects or broad concepts, under each category. Continue working with these groups and rearranging the codes until you develop a framework that aligns with your analysis.
3. Conduct more rounds of qualitative coding
Conduct more iterations of qualitative data coding to review the codes and groups you've already established. You can change the names and codes, combine codes, and re-group the work you've already done during this phase.
In contrast, the initial attempt at data coding may have been hasty and haphazard. But these coding rounds focus on re-analyzing, identifying patterns, and drawing closer to creating concepts and ideas.
Below are a few techniques for qualitative data coding that are often applied in second-round coding.
Pattern coding : To describe a pattern, you join snippets of data, similarly classified under a single umbrella code.
Thematic analysis coding : When examining qualitative data, this method helps to identify patterns or themes.
Selective coding/focused coding : You can generate finished code sets and groups using your first pass of coding.
Theoretical coding : By classifying and arranging codes, theoretical coding allows you to create a theoretical framework's hypothesis. You develop a theory using the codes and groups that have been generated from the qualitative data.
Content analysis coding : This starts with an existing theory or framework and uses qualitative data to either support or expand upon it.
Axial coding : Axial coding allows you to link different codes or groups together. You're looking for connections and linkages between the information you discovered in earlier coding iterations.
Longitudinal coding : In this method, by organizing and systematizing your existing qualitative codes and categories, it is possible to monitor and measure them over time.
Elaborative coding : This involves applying a hypothesis from past research and examining how your present codes and groups relate to it.
4. Integrate codes and groups into your concluding narrative
When you finish going through several rounds of qualitative data coding and applying different forms of coding, use the generated codes and groups to build your final conclusions. The final result of your study could be a collection of findings, theory, or a description, depending on the goal of your study.
Start outlining your hypothesis , observations , and story while citing the codes and groups that served as its foundation. Create your final study results by structuring this data.
- What are the two methods of coding qualitative data?
You can carry out data coding in two ways: automatic and manual. Manual coding involves reading over each comment and manually assigning labels. You'll need to decide if you're using inductive or deductive coding.
Automatic qualitative data analysis uses a branch of computer science known as Natural Language Processing to transform text-based data into a format that computers can comprehend and assess. It's a cutting-edge area of artificial intelligence and machine learning that has the potential to alter how research and insight is designed and delivered.
Although automatic coding is faster than human coding, manual coding still has an edge due to human oversight and limitations in terms of computer power and analysis.
- What are the advantages of qualitative research coding?
Here are the benefits of qualitative research coding:
Boosts validity : gives your data structure and organization to be more certain the conclusions you are drawing from it are valid
Reduces bias : minimizes interpretation biases by forcing the researcher to undertake a systematic review and analysis of the data
Represents participants well : ensures your analysis reflects the views and beliefs of your participant pool and prevents you from overrepresenting the views of any individual or group
Fosters transparency : allows for a logical and systematic assessment of your study by other academics
- What are the challenges of qualitative research coding?
It would be best to consider theoretical and practical limitations while analyzing and interpreting data. Here are the challenges of qualitative research coding:
Labor-intensive: While you can use software for large-scale text management and recording, data analysis is often verified or completed manually.
Lack of reliability: Qualitative research is often criticized due to a lack of transparency and standardization in the coding and analysis process, being subject to a collection of researcher bias.
Limited generalizability : Detailed information on specific contexts is often gathered using small samples. Drawing generalizable findings is challenging even with well-constructed analysis processes as data may need to be more widely gathered to be genuinely representative of attitudes and beliefs within larger populations.
Subjectivity : It is challenging to reproduce qualitative research due to researcher bias in data analysis and interpretation. When analyzing data, the researchers make personal value judgments about what is relevant and what is not. Thus, different people may interpret the same data differently.
- What are the tips for coding qualitative data?
Here are some suggestions for optimizing the value of your qualitative research now that you are familiar with the fundamentals of coding qualitative data.
Keep track of your codes using a codebook or code frame
It can be challenging to recall all your codes offhand as you code more and more data. Keeping track of your codes in a codebook or code frame will keep you organized as you analyze the data. An Excel spreadsheet or word processing document might be your codebook's basic format.
Ensure you track:
The label applied to each code and the time it was first coded or modified
An explanation of the idea or subject matter that the code relates to
Who the original coder is
Any notes on the relationship between the code and other codes in your analysis
Add new codes to your codebook as you code new data, and rearrange categories and themes as necessary.
- How do you create high-quality codes?
Here are four useful tips to help you create high-quality codes.
1. Cover as many survey responses as possible
The code should be generic enough to aid your analysis while remaining general enough to apply to various comments. For instance, "product" is a general code that can apply to many replies but is also ambiguous.
Also, the specific statement, "product stops working after using it for 3 hours" is unlikely to apply to many answers. A good compromise might be "poor product quality" or "short product lifespan."
2. Avoid similarities
Having similar codes is acceptable only if they serve different objectives. While "product" and "customer service" differ from each other, "customer support" and "customer service" can be unified into a single code.
3. Take note of the positive and the negative
Establish contrasting codes to track an issue's negative and positive aspects separately. For instance, two codes to identify distinct themes would be "excellent customer service" and "poor customer service."
4. Minimize data—to a point
Try to balance having too many and too few codes in your analysis to make it as useful as possible.
What is the best way to code qualitative data?
Depending on the goal of your research, the procedure of coding qualitative data can vary. But generally, it entails:
Reading through your data
Assigning codes to selected passages
Carrying out several rounds of coding
Grouping codes into themes
Developing interpretations that result in your final research conclusions
You can begin by first coding snippets of text or data to summarize or characterize them and then add your interpretative perspective in the second round of coding.
A few techniques are more or less acceptable depending on your study’s goal; there is no right or incorrect way to code a data set.
What is an example of a code in qualitative research?
A code is, at its most basic level, a label specifying how you should read a text. The phrase, "Pigeons assaulted me and took my meal," is an illustration. You can use pigeons as a code word.
Is there coding in qualitative research?
An essential component of qualitative data analysis is coding. Coding aims to give structure to free-form data so one can systematically study it.
Should you be using a customer insights hub?
Do you want to discover previous research faster?
Do you share your research findings with others?
Do you analyze research data?
Start for free today, add your research, and get to key insights faster
Editor’s picks
Last updated: 18 April 2023
Last updated: 27 February 2023
Last updated: 22 August 2024
Last updated: 5 February 2023
Last updated: 16 August 2024
Last updated: 9 March 2023
Last updated: 30 April 2024
Last updated: 12 December 2023
Last updated: 11 March 2024
Last updated: 4 July 2024
Last updated: 6 March 2024
Last updated: 5 March 2024
Last updated: 13 May 2024
Latest articles
Related topics, .css-je19u9{-webkit-align-items:flex-end;-webkit-box-align:flex-end;-ms-flex-align:flex-end;align-items:flex-end;display:-webkit-box;display:-webkit-flex;display:-ms-flexbox;display:flex;-webkit-flex-direction:row;-ms-flex-direction:row;flex-direction:row;-webkit-box-flex-wrap:wrap;-webkit-flex-wrap:wrap;-ms-flex-wrap:wrap;flex-wrap:wrap;-webkit-box-pack:center;-ms-flex-pack:center;-webkit-justify-content:center;justify-content:center;row-gap:0;text-align:center;max-width:671px;}@media (max-width: 1079px){.css-je19u9{max-width:400px;}.css-je19u9>span{white-space:pre;}}@media (max-width: 799px){.css-je19u9{max-width:400px;}.css-je19u9>span{white-space:pre;}} decide what to .css-1kiodld{max-height:56px;display:-webkit-box;display:-webkit-flex;display:-ms-flexbox;display:flex;-webkit-align-items:center;-webkit-box-align:center;-ms-flex-align:center;align-items:center;}@media (max-width: 1079px){.css-1kiodld{display:none;}} build next, decide what to build next, log in or sign up.
Get started for free
University Library
Qualitative Data Analysis: Coding
- Atlas.ti web
- R for text analysis
- Microsoft Excel & spreadsheets
- Other options
- Planning Qual Data Analysis
- Free Tools for QDA
- QDA with NVivo
- QDA with Atlas.ti
- QDA with MAXQDA
- PKM for QDA
- QDA with Quirkos
- Working Collaboratively
- Qualitative Methods Texts
- Transcription
- Data organization
- Example Publications
Coding Qualitative Data
Planning your coding strategy.
Coding is a qualitative data analysis strategy in which some aspect of the data is assigned a descriptive label that allows the researcher to identify related content across the data. How you decide to code - or whether to code- your data should be driven by your methodology. But there are rarely step-by-step descriptions, and you'll have to make many decisions about how to code for your own project.
Some questions to consider as you decide how to code your data:
What will you code?
What aspects of your data will you code? If you are not coding all of your available data, how will you decide which elements need to be coded? If you have recordings interviews or focus groups, or other types of multimedia data, will you create transcripts to analyze and code? Or will you code the media itself (see Farley, Duppong & Aitken, 2020 on direct coding of audio recordings rather than transcripts).
Where will your codes come from?
Depending on your methodology, your coding scheme may come from previous research and be applied to your data (deductive). Or you my try to develop codes entirely from the data, ignoring as much as possible, previous knowledge of the topic under study, to develop a scheme grounded in your data (inductive). In practice, however, many practices will fall between these two approaches.
How will you apply your codes to your data?
You may decide to use software to code your qualitative data, to re-purpose other software tools (e.g. Word or spreadsheet software) or work primarily with physical versions of your data. Qualitative software is not strictly necessary, though it does offer some advantages, like:
- Codes can be easily re-labeled, merged, or split. You can also choose to apply multiple coding schemes to the same data, which means you can explore multiple ways of understanding the same data. Your analysis, then, is not limited by how often you are able to work with physical data, such as paper transcripts.
- Most software programs for QDA include the ability to export and import coding schemes. This means you can create a re-use a coding scheme from a previous study, or that was developed in outside of the software, without having to manually create each code.
- Some software for QDA includes the ability to directly code image, video, and audio files. This may mean saving time over creating transcripts. Or, your coding may be enhanced by access to the richness of mediated content, compared to transcripts.
- Using QDA software may also allow you the ability to use auto-coding functions. You may be able to automatically code all of the statements by speaker in a focus group transcript, for example, or identify and code all of the paragraphs that include a specific phrase.
What will be coded?
Will you deploy a line-by-line coding approach, with smaller codes eventually condensed into larger categories or concepts? Or will you start with codes applied to larger segments of the text, perhaps later reviewing the examples to explore and re-code for differences between the segments?
How will you explain the coding process?
- Regardless of how you approach coding, the process should be clearly communicated when you report your research, though this is not always the case (Deterding & Waters, 2021).
- Carefully consider the use of phrases like "themes emerged." This phrasing implies that the themes lay passively in the data, waiting for the researcher to pluck them out. This description leaves little room for describing how the researcher "saw" the themes and decided which were relevant to the study. Ryan and Bernard (2003) offer a terrific guide to ways that you might identify themes in the data, using both your own observations as well as manipulations of the data.
How will you report the results of your coding process?
How you report your coding process should align with the methodology you've chosen. Your methodology may call for careful and consistent application of a coding scheme, with reports of inter-rater reliability and counts of how often a code appears within the data. Or you may use the codes to help develop a rich description of an experience, without needing to indicate precisely how often the code was applied.
How will you code collaboratively?
If you are working with another researcher or a team, your coding process requires careful planning and implementation. You will likely need to have regular conversations about your process, particularly if your goal is to develop and consistently apply a coding scheme across your data.
Coding Features in QDA Software Programs
- Atlas.ti (Mac)
- Atlas.ti (Windows)
- NVivo (Windows)
- NVivo (Mac)
- Coding data See how to create and manage codes and apply codes to segments of the data (known as quotations in Atlas.ti).
- Search and Code Using the search and code feature lets you locate and automatically code data through text search, regular expressions, Named Entity Recognition, and Sentiment Analysis.
- Focus Group Coding Properly prepared focus group documents can be automatically coded by speaker.
- Inter-Coder Agreement Coded text, audio, and video documents can be tested for inter-coder agreement. ICA is not available for images or PDF documents.
- Quotation Reader Once you've coded data, you can view just the data that has been assigned that code.
- Find Redundant Codings (Mac) This tool identifies "overlapping or embedded" quotations that have the same code, that are the result of manual coding or errors when merging project files.
- Coding Data in Atlas.ti (Windows) Demonstrates how to create new codes, manage codes and applying codes to segments of the data (known as quotations in Atlas.ti)
- Search and Code in Atlas.ti (Windows) You can use a text search, regular expressions, Named Entity Recognition, and Sentiment Analysis to identify and automatically code data in Atlas.ti.
- Focus Group Coding in Atlas.ti (Windows) Properly prepared focus group transcripts can be automatically coded by speaker.
- Inter-coder Agreement in Atlas.ti (Windows) Coded text, audio, and video documents can be tested for inter-coder agreement. ICA is not available for images or PDF documents.
- Quotation Reader in Atlas.ti (Windows) Once you've coded data, you can view and export the quotations that have been assigned that code.
- Find Redundant Codings in Atlas.ti (Windows) This tool identifies "overlapping or embedded" quotations that have the same code, that are the result of manual coding or errors when merging project files.
- Coding in NVivo (Windows) This page includes an overview of the coding features in NVivo.
- Automatic Coding in Documents in NVivo (Windows) You can use paragraph formatting styles or speaker names to automatically format documents.
- Coding Comparison Query in NVivo (Windows) You can use the coding comparison feature to compare how different users have coded data in NVivo.
- Review the References in a Node in NVivo (Windows) References are the term that NVivo uses for coded segments of the data. This shows you how to view references related to a code (or any node)
- Text Search Queries in NVivo (Windows) Text queries let you search for specific text in your data. The results of your query can be saved as a node (a form of auto coding).
- Coding Query in NVivo (Windows) Use a coding query to display references from your data for a single code or multiples of codes.
- Code Files and Manage Codes in NVivo (Mac) This page offers an overview of coding features in NVivo. Note that NVivo uses the concept of a node to refer to any structure around which you organize your data. Codes are a type of node, but you may see these terms used interchangeably.
- Automatic Coding in Datasets in NVivo (Mac) A dataset in NVivo is data that is in rows and columns, as in a spreadsheet. If a column is set to be codable, you can also automatically code the data. This approach could be used for coding open-ended survey data.
- Text Search Query in NVivo (Mac) Use the text search query to identify relevant text in your data and automatically code references by saving as a node.
- Review the References in a Node in NVivo (Mac) NVivo uses the term references to refer to data that has been assigned to a code or any node. You can use the reference view to see the data linked to a specific node or combination of nodes.
- Coding Comparison Query in NVivo (Mac) Use the coding comparison query to calculate a measure of inter-rater reliability when you've worked with multiple coders.
The MAXQDA interface is the same across Mac and Windows devices.
- The "Code System" in MAXQDA This section of the manual shows how to create and manage codes in MAXQDA's code system.
- How to Code with MAXQDA
- Display Coded Segments in the Document Browser Once you've coded a document within MAXQDA, you can choose which of those codings will appear on the document, as well as choose whether or not the text is highlighted in the color linked to the code.
- Creative Coding in MAXQDA Use the creative coding feature to explore the relationships between codes in your system. If you develop a new structure to you codes that you like, you can apply the changes to your overall code scheme.
- Text Search in MAXQDA Use a Text Search to identify data that matches your search terms and automatically code the results. You can choose whether to code only the matching results, the sentence the results are in, or the paragraph the results appear in.
- Segment Retrieval in MAXQDA Data that has been coded is considered a segment. Segment retrieval is how you display the segments that match a code or combination of codes. You can use the activation feature to show only the segments from a document group, or that match a document variable.
- Intercorder Agreement in MAXQDA MAXQDA includes the ability to compare coding between two coders on a single project.
- Create Tags in Taguette Taguette uses the term tag to refer to codes. You can create single tags as well as a tag hierarchy using punctuation marks.
- Highlighting in Taguette Select text with a document (a highlight) and apply tags to code data in Taguette.
Useful Resources on Coding

Deterding, N. M., & Waters, M. C. (2021). Flexible coding of in-depth interviews: A twenty-first-century approach. Sociological Methods & Research , 50 (2), 708–739. https://doi.org/10.1177/0049124118799377
Farley, J., Duppong Hurley, K., & Aitken, A. A. (2020). Monitoring implementation in program evaluation with direct audio coding. Evaluation and Program Planning , 83 , 101854. https://doi.org/10.1016/j.evalprogplan.2020.101854
Ryan, G. W., & Bernard, H. R. (2003). Techniques to identify themes. Field Methods , 15 (1), 85–109. https://doi.org/10.1177/1525822X02239569.
- << Previous: Data organization
- Next: Citations >>
- Last Updated: Sep 4, 2024 10:13 AM
- URL: https://guides.library.illinois.edu/qualitative

The Ultimate Guide to Qualitative Research - Part 2: Handling Qualitative Data

- Handling qualitative data
- Transcripts
- Field notes
- Survey data and responses
- Visual and audio data
- Data organization
- Introduction
Qualitative data
Coding qualitative data, coding methods, using atlas.ti for qualitative data coding, automated coding tools in atlas.ti.
- Coding frame
- Auto and smart coding
- Organizing codes
- Qualitative data analysis
- Content analysis
- Thematic analysis
- Thematic analysis vs. content analysis
- Narrative research
- Phenomenological research
- Discourse analysis
- Grounded theory
- Deductive reasoning
- Inductive reasoning
- Inductive vs. deductive reasoning
- Qualitative data interpretation
- Qualitative data analysis software
Coding qualitative data for valuable insights
Qualitative researchers, at one point or another, will inevitably find themselves involved in coding their data. The coding process can be arduous and time-consuming, so it's essential to understand how coding contributes to the understanding of knowledge in qualitative research .

Qualitative research tends to work with unstructured data that requires some systematic organization to facilitate insights relevant to your research inquiry. Suppose you need to determine the most critical aspects for deciding what hotel to stay in when you go on vacation. The decision process that goes into choosing the "best" hotel can be located in various and separate places (e.g., travel websites, blogs, personal conversations) and scattered among pieces of information that may not be relevant to you. In qualitative research, one of the goals prior to data analysis is to identify what information is important, find that information, and sort that information in a way that makes it easy for you to come to a decision.

Qualitative coding is almost always a necessary part of the qualitative data analysis process . Coding provides a way to make the meaning of the data clear to you and to your research audience.
What is a code?
A code in the context of qualitative data analysis is a summary of a larger segment of text. Imagine applying a couple of sticky notes to a collection of recipes, marking each section with short labels like "ingredients," "directions," and "advice." Afterward, someone can page through those recipes and easily locate the section they are looking for, thanks to those sticky notes.
Now, suppose you have different colors of sticky notes, where each color denotes a particular cuisine (e.g., Italian, Chinese, vegetarian). Now, with two ways to organize the data in front of you, you can look at all of the ingredient sections of all the recipes belonging to a cuisine to get a sense of the items that are commonly used for such recipes.
As illustrated in this example, one reason someone might apply sticky notes to a recipe is to help the reader save time in getting the desired information from that text, which is essentially the goal of qualitative coding. Coding allows a reader to get the information they are looking for to facilitate the analysis process. Moreover, this process of categorizing the different pieces of data helps researchers see what is going on in their data and identify emerging dimensions and patterns.
The use of codes also has a purpose beyond simply establishing a convenient means to draw meaning from the data . When presenting qualitative research to an audience, researchers could rely on a narrative summary of the data, but such narratives might be too lengthy to grasp or difficult to convey to others.
As a result, researchers in all fields tend to rely on data visualizations to illustrate their data analysis . Naturally, suppose such visualizations rely on tables and figures like bar charts and diagrams to convey meaning. In that case, researchers need to find ways to "count" the data along established data points, which is a role that coding can fulfill. While a strictly numerical understanding of qualitative research may overlook the finer aspects of social phenomena, researchers ultimately benefit from an analysis of the frequency of codes, combinations of codes, and patterns of codes that can contribute to theory generation. In addition, codes can be visualized in numerous ways to present qualitative insights. From flow charts to semantic networks, codes provide researchers with almost limitless possibilities in choosing how to present their rich qualitative data to different audiences.
Applying codes
To engage in coding, a researcher looks at the data line-by-line and develops a codebook by identifying data segments that can be represented by words or short phrases.

In the example above, a set of three paragraphs is represented by one code displayed in green in the right margin. Without codes, the researcher might have to re-read all of the text to remind themselves what the data is about. Indeed, any researcher who examines the codebook of a project can glean a sense of the data and analysis.
Analyzing codes
Think of a simple example to illustrate the importance of analyzing codes. Suppose you are analyzing survey responses for people's preferences for shopping in brick-and-mortar stores and shopping online. In that case, you might think about marking each survey response as either "prefers shopping in-person" or "prefers shopping online." Once you have applied the relevant codes to each survey response, you can compare the frequencies of both codes to determine where the population as a whole stands on the subject.
Among other things, codes can be analyzed by their frequency or their connection to other codes (or co-occurrence with other codes). In the example above, you may also decide to code the data for the reasons that inform people's shopping habits, applying labels such as "convenience," "value," and "service." Then, the analysis process is simply a matter of determining how often each reason co-occurs with preferences for in-person shopping and online shopping by analyzing the codes applied to the data.
As a result, qualitative coding transforms raw data into a form that facilitates the generation of deeper insights through empirical analysis.
That said, coding is a time-consuming, albeit necessary, task in qualitative research and one that researchers have developed into an array of established methods that are worth briefly looking at.
Years of development of qualitative research methods have yielded multiple methods for assigning codes to data. While all qualitative coding approaches essentially seek to summarize large amounts of information succinctly, there are various approaches you can apply to your coding process.
Inductive coding
Probably the most basic form of coding is to look at the data and reduce it to its salient points of information through coding. Any inductive approach to research involves generating knowledge from the ground up. Inductive coding, as a result, looks to generate insights from the qualitative data itself.
Inductive coding benefits researchers who need to look at the data primarily for its inherent meaning rather than for how external frameworks of knowledge might look at it. Inductive coding can also provide a new perspective that established theory has yet to consider, which would make a theory-driven approach inappropriate.
Deductive coding
A deductive approach to coding is also useful in qualitative research . In contrast with inductive coding, a deductive coding approach applies an existing research framework or previous research study to new data. This means that the researcher applies a set of predefined codes based on established research to the new data.
Researchers can benefit from using both approaches in tandem if their research questions call for a synthesized analysis . Returning to the example of a cookbook, a person may mark the different sections of each recipe because they have prior knowledge about what a typical recipe might look like. On the other hand, if they come across a non-typical recipe (e.g., a recipe that may not have an ingredients section), they might need to create new codes to identify parts of the recipe that seem unusual or novel.
Employing both inductive coding and deductive coding , as a result, can help you achieve a more holistic analysis of your data by building on existing knowledge of a phenomenon while generating new knowledge about the less familiar aspects.
Thematic analysis coding
Whether you decide to apply an inductive coding or deductive coding approach to qualitative data, the coding should also be relevant to your research inquiry in order to be useful and avoid a cumbersome amount of coding that might defeat the purpose of summarizing your data. Let's look at a series of more specific approaches to qualitative coding to get a wider sense of how coding has been applied to qualitative research.
The goal of a thematic analysis arising from coding , as the name suggests, is to identify themes revolving around a particular concept or phenomenon. While concepts in the natural sciences, such as temperature and atomic weight, can be measured with numerical data, concepts in the social sciences often escape easy numerical analysis. Rather than reduce the beauty of a work of art or proficiency in a foreign language down to a number, thematic analysis coding looks to describe these phenomena by various aspects that can be grouped together within common themes.
Looking at the recipe again, we can describe a typical recipe by the sections that appear the most often. The same is true for describing a sport (e.g., rules, strategies, equipment) or a car (e.g., type, price, fuel efficiency, safety rating). While later analysis might be able to numerically measure these themes if they are particular enough, the role of coding along the lines of themes provides a good starting point for recognizing and analyzing relevant concepts.
Process coding
Processes are phenomena that are characterized by action. Think about the act of driving a car rather than describing the car itself. In this case, process coding can be thought of as an extension of thematic coding, except that the major aspects of a process can also be identified by sequences and patterns, on the assumption that some actions may follow other actions. After all, drivers typically turn the key in the ignition before releasing the parking brake or shifting to drive. Capturing the specific phases and sequences is a key objective in process coding.
Structural coding
The "structure" of a recipe in a cookbook is different from that of an essay or a newspaper article. Also, think about how an interview for research might be structured differently from an interview for a TV news program. Researchers can employ structural coding to organize the data according to its distinct structural elements, such as specific elements, the ordering of information, or the purpose behind different structures. This kind of analysis could help, for instance, to achieve a greater understanding of how cultures shape a particular piece of writing or social practice.
Longitudinal coding
Studies that observe people or practices over time do so to capture and understand changes in dynamic environments. The role of longitudinal coding is to also code for relevant contextual or temporal aspects. These can then be analyzed together with other codes to assess how frequencies and patterns change from one observation or interview to the next. This will help researchers empirically illustrate differences or changes over time.

Whatever your approach, code your data with ATLAS.ti
Powerful tools for manual coding and automated coding. Check them out with a free trial.
Qualitative data analysis software should effectively facilitate qualitative coding. Researchers can choose between manual coding and automated coding , where tools can be employed to suggest and apply codes to save time. ATLAS.ti is ideal for both approaches to suit researchers of all needs and backgrounds.
Manual coding
At the core of any qualitative data analysis software is the interface that allows researchers the freedom of assigning codes to qualitative data . ATLAS.ti's interface for viewing data makes it easy to highlight data segments and apply new codes or existing codes quickly and efficiently.

In vivo coding
Interpreting qualitative data to create codes is often a part of the coding process. This can mean that the names of codes may differ from the actual text of the data itself.
However, the best names for codes sometimes come from the textual data itself, as opposed to some interpretation of the text. As a result, there may be a particular word or short phrase that stands out to you in your data set, compelling you to incorporate that word or phrase into your qualitative codes. Think about how social media has slang or acronyms like "YOLO" or "YMMV" which condense a lot of meaning or convey something of importance in the context of the research. Rather than obscuring participants’ meanings or experiences within another layer of interpretation, researchers can build meaningful and rich insights by using participants’ own words to create in vivo codes .

In vivo coding is a handy feature in ATLAS.ti for when you come across a key term or phrase that you want to create a code out of. Simply highlight the desired text and click on "Code in Vivo" to create a new code instantly.
Code Manager
One of the biggest challenges of coding qualitative data is keeping track of dozens or even hundreds of codes, because a lack of organization may hinder researchers in the main objective of succinctly summarizing qualitative data.

Once you have developed and applied a set of codes to your project data, you can open the Code Manager to gain a bird's eye view of all of your codes so you can develop and reorganize them, into hierarchies, groups, or however you prefer. Your list of codes can also be exported to share with others or use in other qualitative or quantitative analysis software .
Use ATLAS.ti for efficient and insightful coding
Intuitive tools to help you code and analyze your data, available starting with a free trial.
Traditionally, qualitative researchers would perform this coding on their data manually by hand, which involves carefully reading each piece of data and attaching codes. For qualitative researchers using pen and paper, they can use highlighters or bookmark flags to mark the key points in their data for later reference. Qualitative researchers also have powerful qualitative data analysis software they can rely on to facilitate all aspects of the coding process.

Although researchers can use qualitative data analysis software to engage in manual coding, there is also now a range of software tools that can even automate the coding process . A number of automated coding tools in ATLAS.ti such as AI Coding, Sentiment Analysis, and Opinion Mining use machine learning and natural language processing to apply useful codes for later analysis. Moreover, other tools in ATLAS.ti rely on pattern recognition to facilitate the creation of descriptive codes throughout your project.
One of the most exciting implications of recent advances in artificial intelligence is its potential for facilitating the research process, especially in qualitative research. The use of machine learning to understand the salient points in data can be especially useful to researchers in all fields.

AI Coding , available in both the Desktop platforms and Web version of ATLAS.ti, performs comprehensive descriptive coding on your qualitative data . It processes data through OpenAI's language models to suggest and apply codes to your project in a fraction of the time that it would take to do manually.
Sentiment Analysis
Participants may often express sentiments that are positive or negative in nature. If you are interested in analyzing the feelings expressed in your data, you can analyze these sentiments . To conduct automated coding for these sentiments, ATLAS.ti employs machine learning to process your data quickly and suggest codes to be applied to relevant data segments.

Opinion Mining
If you want to understand both what participants talked about and how they felt about it, you can conduct Opinion Mining. This tool synthesizes key phrases in your textual data according to whether they are being talked about in a positive or negative manner. The codes generated from Opinion Mining can provide a useful illustration of how language in interviews, focus groups, and surveys is used when discussing certain topics or phenomena.

Code qualitative data with ATLAS.ti
Download a free trial of ATLAS.ti and code your data with ease.
Coding Qualitative Data
- First Online: 02 January 2023
Cite this chapter

- Marla Rogers 4
Part of the book series: Springer Texts in Education ((SPTE))
5996 Accesses
1 Citations
With the advent and proliferation of analysis software (e.g., Nvivo, Atlas.ti), coding data has become much easier in terms of application. Where autocoding algorithms do much to assist and enlighten a researcher in analysis, coding qualitative data remains an act that must largely be undertaken by a human in order to fully address the research question(s) (Kaufmann, A. A., Barcomb, A., & Riehle, D. (2020). Supporting interview analysis with autocoding. HICSS. https://www.semanticscholar.org/paper/Supporting-Interview-Analysis-with-Autocoding-Kaufmann-Barcomb/b6e045859b5ce94e1eb144a9545b26c5e9fa6f32 ). Even seasoned qualitative researchers can find the process of coding their datum corpus to be arduous at times. For novice researchers, the task can quickly become baffling and overwhelming.
This is a preview of subscription content, log in via an institution to check access.
Access this chapter
Subscribe and save.
- Get 10 units per month
- Download Article/Chapter or eBook
- 1 Unit = 1 Article or 1 Chapter
- Cancel anytime
- Available as PDF
- Read on any device
- Instant download
- Own it forever
- Available as EPUB and PDF
- Compact, lightweight edition
- Dispatched in 3 to 5 business days
- Free shipping worldwide - see info
Tax calculation will be finalised at checkout
Purchases are for personal use only
Institutional subscriptions
Analyzing Qualitative Data Using NVivo

Creating Inheritable Digital Codebooks for Qualitative Research Data Analysis

How We Code
Anonymous Author. (2019, July 2). Resolve: Finding a resolution for infertility: Infertility support group and discussion community [online discussion post]. https://www.inspire.com/
Basit, T. N. (2003). Manual or electronic? The role of coding in qualitative data analysis. Educational Research, 45 (2), 143–154.
Article Google Scholar
Braun, V., & Clarke, V. (2006). Using thematic analysis in psychology. Qualitative Research in Psychology, 3 (2), 77–101.
Caulfield, J. (2019, September 6). How to do thematic analysis . www.scribbr.com/methodology/thematicanalysis
Creswell, J. (2015). 30 Essential skills for the qualitative researcher . SAGE.
Google Scholar
Elliot, V. (2018). Thinking about the coding process in qualitative data analysis. The Qualitative Report, 23 (11), 2850–2861. https://nsuworks.nova.edu/tqr/vol23/iss11/14
Kaufmann, A. A., Barcomb, A., & Riehle, D. (2020). Supporting interview analysis with autocoding. HICSS. https://www.semanticscholar.org/paper/Supporting-Interview-Analysis-with-Autocoding-Kaufmann-Barcomb/b6e045859b5ce94e1eb144a9545b26c5e9fa6f32
Saldana, J. (2009). The coding manual for qualitative researchers. SAGE.
Further Readings
Analyzing Qualitative Data: Nvivo 12 Pro for Windows (2 hours). https://www.youtube.com/watch?v=CKPS4LF9G8A
How to Analyze Interview Transcripts. (2 minutes). https://www.rev.com/blog/analyze-interview-transcripts-in-qualitative-research
How to Know You Are Coding Correctly (4 minutes). https://www.youtube.com/watch?v=iL7Ww5kpnIM
Download references
Author information
Authors and affiliations.
University of Saskatchewan, Saskatoon, Canada
Marla Rogers
You can also search for this author in PubMed Google Scholar
Corresponding author
Correspondence to Marla Rogers .
Editor information
Editors and affiliations.
Department of Educational Administration, College of Education, University of Saskatchewan, Saskatoon, SK, Canada
Janet Mola Okoko
Scott Tunison
Department of Educational Administration, University of Saskatchewan, Saskatoon, SK, Canada
Keith D. Walker
Rights and permissions
Reprints and permissions
Copyright information
© 2023 The Author(s), under exclusive license to Springer Nature Switzerland AG
About this chapter
Rogers, M. (2023). Coding Qualitative Data. In: Okoko, J.M., Tunison, S., Walker, K.D. (eds) Varieties of Qualitative Research Methods. Springer Texts in Education. Springer, Cham. https://doi.org/10.1007/978-3-031-04394-9_12
Download citation
DOI : https://doi.org/10.1007/978-3-031-04394-9_12
Published : 02 January 2023
Publisher Name : Springer, Cham
Print ISBN : 978-3-031-04396-3
Online ISBN : 978-3-031-04394-9
eBook Packages : Education Education (R0)
Share this chapter
Anyone you share the following link with will be able to read this content:
Sorry, a shareable link is not currently available for this article.
Provided by the Springer Nature SharedIt content-sharing initiative
- Publish with us
Policies and ethics
- Find a journal
- Track your research
The Coding Manual for Qualitative Researchers
Student resources.
Welcome to the companion website for The Coding Manual for Qualitative Research , third edition, by Johnny Saldaña. This website offers a wealth of additional resources to support students and lecturers including:
CAQDAS links giving guidance and links to a variety of qualitative data analysis software.
Code lists including data extracted from the author’s study, “Lifelong Learning Impact: Adult Perceptions of Their High School Speech and/or Theatre Participation” (McCammon, Saldaña, Hines, & Omasta, 2012), which you can download and make your own practice manipulations to the data.
Coding examples from SAGE journals providing actual examples of coding at work, giving you insight into coding procedures.
Three sample interview transcripts that allow you to test your coding skills.
Group exercises for small and large groups encourage you to get to grips with basic principles of coding, partner development, categorization and qualitative data analysis
Flashcard glossary of terms enables you to test your knowledge of the terminology commonly used in qualitative research and coding.
About the book
Johnny Saldaña’s unique and invaluable manual demystifies the qualitative coding process with a comprehensive assessment of different coding types, examples and exercises. The ideal reference for students, teachers, and practitioners of qualitative inquiry, it is essential reading across the social sciences and neatly guides you through the multiple approaches available for coding qualitative data.
Its wide array of strategies, from the more straightforward to the more complex, is skilfully explained and carefully exemplified, providing a complete toolkit of codes and skills that can be applied to any research project. For each code Saldaña provides information about the method's origin, gives a detailed description of the method, demonstrates its practical applications, and sets out a clearly illustrated example with analytic follow up.
This international bestseller is an extremely usable, robust manual and is a must-have resource for qualitative researchers at all levels.
This website may contain links to both internal and external websites. All links included were active at the time the website was launched. SAGE does not operate these external websites and does not necessarily endorse the views expressed within them. SAGE cannot take responsibility for the changing content or nature of linked sites, as these sites are outside of our control and subject to change without our knowledge. If you do find an inactive link to an external website, please try to locate that website by using a search engine. SAGE will endeavour to update inactive or broken links when possible.

Want to create or adapt books like this? Learn more about how Pressbooks supports open publishing practices.
Chapter 10: Qualitative Data Collection & Analysis Methods
10.6 Qualitative Coding, Analysis, and Write-up: The How to Guide
This section provides an abbreviated set of steps and directions for coding, analyzing, and writing up qualitative data, taking an inductive approach. The following material is adapted from Research Rundowns, retrieved from https://researchrundowns.com/qual/qualitative-coding-analysis/ .
Step 1: Open Coding
At this first level of coding, the researcher is looking for distinct concepts and categories in the data, which will form the basic units of the analysis. In other words, the researcher is breaking down the data into first level concepts, or master headings, and second-level categories, or subheadings.
Researchers often use highlighters to distinguish concepts and categories. For example, if interviewees consistently talk about teaching methods, each time an interviewee mentions teaching methods, or something related to a teaching method, the researcher uses the same colour highlight. Teaching methods would become a concept, and other things related (types, etc.) would become categories – all highlighted in the same colour. It is valuable to use different coloured highlights to distinguish each broad concept and category. At the end of this stage, the transcripts contain many different colours of highlighted text. The next step is to transfer these into a brief outline, with main headings for concepts and subheadings for categories.
Step 2: Axial (Focused) Coding
In open coding, the researcher is focused primarily on the text from the interviews to define concepts and categories. In axial coding, the researcher is using the concepts and categories developed in the open coding process, while re-reading the text from the interviews. This step is undertaken to confirm that the concepts and categories accurately represent interview responses.
In axial coding, the researcher explores how the concepts and categories are related. To examine the latter, you might ask: What conditions caused or influenced concepts and categories? What is/was the social/political context? What are the associated effects or consequences? For example, let us suppose that one of the concepts is Adaptive Teaching , and two of the categories are tutoring and group projects . The researcher would then ask: What conditions caused or influenced tutoring and group projects to occur? From the interview transcripts, it is apparent that participants linked this condition (being able to offer tutoring and group projects) with being enabled by a supportive principle. Consequently, an axial code might be a phrase like our principal encourages different teaching methods . This discusses the context of the concept and/or categories and suggests that the researcher may need a new category labeled “supportive environment.” Axial coding is merely a more directed approach to looking at the data, to help make sure that the researcher has identified all important aspects.
Step 3: Build a Data Table
Table 10.4 illustrates how to transfer the final concepts and categories into a data table. This is a very effective way to organize results and/or discussion in a research paper. While this appears to be a quick process, it requires a lot of time to do it well.
Table 10.4 Major categories and associated concept
| Open Coding | ||
| Axial Coding Themes | ||
| New Category | ||
Step 4: Analysis & Write-Up
Not only is Table 10.4 an effective way to organize the analysis, it is also a good approach for assisting with the data analysis write-up. The first step in the analysis process is to discuss the various categories and describe the associated concepts. As part of this process, the researcher will describe the themes created in the axial coding process (the second step).
There are a variety of ways to present the data in the write-up, including: 1) telling a story; 2) using a metaphor; 3) comparing and contrasting; 4) examining relations among concepts/variables; and 5) counting. Please note that counting should not be a stand-alone qualitative data analysis process to use when writing up the results, because it cannot convey the richness of the data that has been collected. One can certainly use counting for stating the number of participants, or how many participants spoke about a specific theme or category; however, the researcher must present a much deeper level of analysis by drawing out the words of the participants, including the use of direct quotes from the participants´ interviews to demonstrate the validity of the various themes.
Here are some resources for demonstrations on other methods for coding qualitative data:
- Qualitative Data Analysis [PDF]
When writing up the analysis, it is best to “identify” participants through a number, alphabetical letter, or pseudonym in the write-up (e.g. Participant #3 stated …). This demonstrates that you drawing data from all of the participants. Think of it this way, if you were doing quantitative analysis on data from 400 participants, you would present the data for all 400 participants, assuming they all answered a specific question. You will often see in a table of quantitative results (n=400), indicating that 400 people answered the question. This is the researcher’s way of confirming, to the reader, how many participants answered a particular research question. Assigning participant numbers, letters, or pseudonyms serves the same purpose in qualitative analysis.
Research Methods for the Social Sciences: An Introduction Copyright © 2020 by Valerie Sheppard is licensed under a Creative Commons Attribution-NonCommercial-ShareAlike 4.0 International License , except where otherwise noted.
Share This Book

Coding Qualitative Data: A Beginner’s How-To + Examples

When gathering feedback, whether it’s from surveys , online reviews, or social mentions , the most valuable insights usually come from free-form or open-ended responses.
Though these types of responses allow for more detailed feedback, they are also difficult to measure and analyse on a large scale. Coding qualitative data allows you to transform these unique responses into quantitative metrics that can be compared to the rest of your data set.
Read on to learn about this process.
What is Qualitative Data Coding?

Qualitative data coding is the process of assigning quantitative tags to the pieces of data. This is necessary for any type of large-scale analysis because you 1) need to have a consistent way to compare and contrast each piece of qualitative data, and 2) will be able to use tools like Excel and Google Sheets to manipulate quantitative data.
For example, if a customer writes a Yelp review stating “The atmosphere was great for a Friday night, but the food was a bit overpriced,” you can assign quantitative tags based on a scale or sentiment. We’ll get into how exactly to assign these tags in the next section.
Inductive Coding vs Deductive Coding

When deciding how you will scale and code your data, you’ll first have to choose between the inductive or deductive methods. We cover the pros and cons of each method below.
Inductive Coding
Inductive coding is when you don’t already have a set scale or measurement with which to tag the data. If you’re analysing a large amount of qualitative data for the first time, such as the first round of a customer feedback survey, then you will likely need to start with inductive coding since you don’t know exactly what you will be measuring yet.
Inductive coding can be a lengthy process, as you’ll need to comb through your data manually. Luckily, things get easier the second time around when you’re able to use deductive coding.
Deductive Coding
Deductive coding is when you already have a predetermined scale or set of tags that you want to use on your data. This is usually if you’ve already analysed a set of qualitative data with inductive reasoning and want to use the same metrics.
To continue from the example above, say you noticed in the first round that a lot of Yelp reviews mentioned the price of food, and, using inductive coding, you were able to create a scale of 1-5 to measure appetisers, entrees, and desserts.
When analysing new Yelp reviews six months later, you’ll be able to keep the same scale and tag the new responses based on deductive coding, and therefore compare the data to the first round of analysis.
3 Steps for Coding Qualitative Data From the Top-Down

For this section, we will assume that we’re using inductive coding.
1. Start with Broad Categories
The first thing you will want to do is sort your data into broad categories. Think of each of these categories as specific aspects you want to know more about.
To continue with the restaurant example, your categories could include food quality, food price, atmosphere, location, service, etc.
Or for a business in the B2B space, your categories could look something like product quality, product price, customer service, chatbot quality, etc.
2. Assign Emotions or Sentiments
The next step is to then go through each category and assign a sentiment or emotion to each piece of data. In the broadest terms, you can start with just positive emotion and negative emotion.
Remember that when using inductive coding, you’re figuring out your scale and measurements as you go, so you can always start with broad analysis and drill down deeper as you become more familiar with your data.
3. Combine Categories and Sentiments to Draw Conclusions
Once you’ve sorted your data into categories and assigned sentiments, you can start comparing the numbers and drawing conclusions.
For example, perhaps you see that out of the 500 Yelp reviews you’ve analysed, 300 fall into the food price/negative sentiment section of your data. That’s a pretty clear indication that customers think your food is too expensive, and you may see an improvement in customer retention by dropping prices.
The three steps outlined above cover just the very basics of coding qualitative data, so you can understand the theory behind the analysis.
In order to gain more detailed conclusions, you’ll likely need to dig deeper into the data by assigning more complex sentiment tags and breaking down the categories further. We cover some useful tips and a coding qualitative data example below.
4 Tips to Keep in Mind for Accurate Qualitative Data Coding

Here are some helpful reminders to keep on hand when going through the three steps outlined above.
1. Start with a Small Sample of the Data
You’ll want to start with a small sample of your data to make sure the tags you’re using will be applicable to the rest of the set. You don’t want to waste time by going through and manually tagging each piece of data, only to realise at the end that the tags you’ve been using actually aren’t accurate.
Once you’ve broken up your qualitative data into the different categories, choose 10-20% of responses in each category to tag using inductive coding.
Then, continue onto the analysis phase using just that 10-20%.
If you’re able to find takeaways and easily compare the data with that small sample size , then you can continue coding the rest of the data in that same way, adding additional tags where needed.
2. Use Numerical Scales for Deeper Analysis
Instead of just assigning positive and negative sentiments to your data points, you can break this down even further by utilising numerical scales.
Exactly how negative or how positive was the piece of feedback? In the Yelp review example from the beginning of this article, the reviewer stated that the food was “a bit overpriced.” If you’re using a scale of 1-5 to tag the category “food price,” you could tag this as a ⅗ rating.
You’ll likely need to adjust your scales as you work through your initial sample and get a clearer picture of the review landscape.
Having access to more nuanced data like this is important for making accurate decisions about your business.
If you decided to stick with just positive and negative tags, your “food price” category might end up being 50% negative, indicating that a massive change to your pricing structure is needed immediately.
But if it turns out that most of those negative reviews are actually ⅗’s and not ⅕’s, then the situation isn’t as dire as it might have appeared at first glance.
3. Remember That Each Data Point Can Contain Multiple Pieces of Information
Remember that qualitative data can have multiple sentiments and multiple categories (such as the Yelp review example mentioning both atmosphere and price), so you may need to double or even triple-sort some pieces of data.
That’s the beauty of and the struggle with handling open-ended or free-form responses.
However, these responses allow for more accurate insights into your business vs narrow multiple-choice questions.
4. Be Mindful of Having Too Many Tags
Remember, you’re able to draw conclusions from your qualitative data by combining category tags and sentiment tags.
An easy mistake for data analysis newcomers to make is to end up with so many tags that comparing them becomes impossible. This usually stems from an overabundance of caution that you’re tagging responses accurately.
For example, say you’re tagging a review that’s discussing a restaurant host’s behavior. You put it in the category “host/hostess behavior” and tag it as a ⅗ for the sentiment.
Then, you come across another review discussing a server’s behaviour that’s slightly more positive, so you tag this as “server behaviour” for the category and 3.75/5 for the sentiment.
By getting this granular, you’re going to end up with very few data points in the same category and sentiment, which defeats the purpose of coding qualitative data.
In this example, unless you’re very specifically looking at the behaviour of individual restaurant positions, you’re better off tagging both responses as “customer service” for the category and ⅗ for the sentiment for consistency’s sake.
Coding Qualitative Data Example
Below we’ll walk through an example of coding qualitative data, utilising the steps and tips detailed above.

Step 1: Read through your data and define your categories. For this example, we’ll use “customer service,” “product quality,” and “price.”
Step 2: Sort a sample of the data into the above categories. Remember that each data point can be included in multiple categories.
- “This software is amazing, does exactly what I need it to [Product Quality]. However, I do wish they’d stop raising prices every year as it’s starting to get a little out of my budget [Price].”
- “Love the product [Product Quality], but honestly I can’t deal with the terrible customer service anymore [Customer Service]. I’ll be shopping around for a new solution.”
- “Meh, this software is okay [Product Quality] but cheaper competitors [Price] are just as good with much better customer service [Customer Service].”
Step 3: Assign sentiments to the sample. For more in-depth analysis, use a numerical scale. We’ll use 1-5 in this example, with 1 being the lowest satisfaction and 5 being the highest.
- Product Quality:
- “This software is amazing, does exactly what I need it to do” [5/5]
- “Love the product” [5/5]
- “Meh, this software is okay [⅖]
- Customer Service:
- “Honestly I can’t deal with the terrible customer service anymore [⅕]
- “...Much better customer service,” [⅖]
- “However, I do wish they’d stop raising prices every year as it’s starting to get a little out of my budget.” [⅗]
- “Cheaper competitors are just as good.” [⅖]
Step 4: After confirming that the established category and sentiment tags are accurate, continue steps 1-3 for the rest of your data, adding tags where necessary.
Step 5: Identify recurring patterns using data analysis. You can combine your insights with other types of data , like demographic and psychographic customer profiles.
Step 6: Take action based on what you find! For example, you may discover that customers aged 20-30 were the most likely to provide negative feedback on your customer service team, equating to ⅖ or ⅕ on your coding scale. You may be able to conclude that younger customers need a more streamlined way to communicate with your company, perhaps through an automated chatbot service.
Step 7: Repeat this process with more specific research goals in mind to continue digging deeper into what your customers are thinking and feeling . For example, if you uncover the above insight through coding qualitative data from online reviews, you could send out a customer feedback survey specifically asking free-form questions about how your customers would feel interacting with a chatbot instead.
How AI tools help with Coding Qualitative Data

Now that you understand the work that goes into coding qualitative data, you’re probably wondering if there’s an easier solution than manually sorting through every response.
The good news is that, yes, there is. Advanced AI-backed tools are available to help companies quickly and accurately analyse qualitative data at scale, such as customer surveys and online reviews.
These tools can not only code data based on a set of rules you determine, but they can even do their own inductive coding to determine themes and create the most accurate tags as they go.
These capabilities allow business owners to make accurate decisions about their business based on actual data and free up the necessary time and employee bandwidth to act on these insights.
The infographic below gives a visual summary of how to code qualitative data and why it’s essential for businesses to learn how:

Try Chattermill today today to learn how our AI-powered software can help you make smarter business decisions.
Related articles.
How HelloFresh Leverages Customer Insights to Improve Operational Efficiency for Supply Chain Management
We spoke with Stefan Platteau, Associate Director of Global Product Strategy and Analytics, to learn how Chattermill helped HelloFresh optimize its Operations, Logistics, and Supply Chain Management.

How HelloFresh Turned Product Feedback into New Revenue Streams, Growing to a €7B Business
Learn how HelloFresh partnered with Chattermill to make strategic product decisions based on customer feedback, and drive more efficient business growth.

Video Panel: How top brands use AI to impact customer experience
We were joined by more than 35 customers, partners, and friends who wanted to make sure that their choice of AI drives their business outcomes.
See Chattermill in action
Understand the voice of your customers in realtime with Customer Feedback Analytics from Chattermill.

Guide to Qualitative Data Coding: Best Analysis Methods
Qualitative data is where data becomes insights, and insights drive meaningful action. It's what enables qualitative data to shine, bringing context to life from customers eager to share their honest thoughts about your brand.
But without a plan to make sense of qualitative insights, they're at risk of collecting digital dust. That's where qualitative coding comes in.
In this guide, we're going to walk through how to do qualitative data analysis, so you can turn your qualitative data into the goldmine that it is – and then some.
Below, we'll explore:
Various qualitative data analysis methods
Types of qualitative data sources, and effective strategies for data collection
A walkthrough of the best qualitative coding methods by research goal
Let's dive in!
What is qualitative data coding?
Qualitative data coding is the process of analyzing and categorizing qualitative (non-numerical) data, such as interview transcripts, open-ended survey responses, or observational notes to arrive at patterns and themes.
Coding involves assigning descriptive labels or "codes" to segments of the qualitative data, to summarize and condense the information. Coding can be done inductively, where the codes emerge from the data itself, or deductively, where the researcher starts with a pre-determined set of codes based on existing theories or frameworks.
What's the benefit of qualitative data analysis?
Qualitative data dives into the intricacies of human experiences that quantitative data often overlooks. Qualitative research typically provides a deeper, more nuanced understanding of human behaviour, experiences, perceptions, and motivations. It can reveal the "why" and "how" behind the "what" that quantitative data shows.
Qualitative research is generally more flexible, and can be adapted to explore new or unexpected insights that emerge during the research process. It's a great tool that complements, and enhances quantitative research.

Types of qualitative data
Qualitative data comes in various forms. Each offers unique insights into different aspects of the human experience. Understanding the different types of qualitative data is the key to designing effective research methodologies, and strategies for your team to code qualitative data effectively.
Let’s explore some common types of qualitative data:
1. Textual Data
What it is: Written or verbal data in the form of transcripts, interviews, focus group discussions, open-ended survey responses, social media comments, emails, or customer reviews.
Advantages: Provides rich contextual information, sentiments, opinions, and narratives from direct interactions with customers or stakeholders.
2. Visual Data
What it is: Images, videos, diagrams, infographics, or any visual representation that captures non-verbal cues, gestures, emotions, or environmental contexts.
Advantages: Complements textual data by adding visual context and expressions that enhance the depth of qualitative insights.
3. Audio Data
What it is: Recordings of interviews, phone calls, focus group sessions, or any audio-based interactions.
Advantages: Captures tonal variations, emotions, and nuances in verbal communications, providing additional layers of understanding.
4. Observational Data
What it is: Direct observations of behaviours, interactions, or events in real-time settings such as ethnographic studies, field observations, or usability testing.
Advantages: Offers firsthand insights into natural behaviours, decision-making processes, and contextual factors influencing experiences.
5. Contextual Data
What it is: Information about the context, environment, culture, demographics, or situational factors influencing behaviours or perceptions.
Usage: Helps in interpreting qualitative findings within relevant contexts, identifying cultural nuances, and understanding environmental influences.
6. Metadata
Description: Additional data accompanying qualitative sources, such as timestamps, location information, participant demographics, or categorizations.
Advantages: Provides context, aids in organizing and filtering data, and supports comparative analysis across different segments or timeframes.
7. Historical Data
Description: Past records, archival materials, historical documents, or retrospective accounts relevant to the research topic.
Advantages: Offers historical perspectives, longitudinal insights, and continuity in understanding changes, trends, or patterns over time.
8. Digital Data
Description: Data generated from digital interactions, online platforms, websites, social media, digital surveys, or user-generated content.
Advantages: Reflects digital behaviours, user experiences, online sentiments, and interactions in virtual environments.
9. Multi-modal Data
Description: Integration of multiple data types such as textual, visual, audio, and contextual data sources for comprehensive analysis.
Advantages: Enables triangulation of findings, validation of insights across different modalities, and holistic understanding of complex phenomena.
10. Secondary Data
Description: Existing data sources, literature reviews, case studies, or research studies conducted by other researchers or organizations.
Advantages: Supplements primary qualitative data, provides comparative insights, validates findings, or offers historical context to research outcomes.
Understanding when, and how, to use each data type will elevate your overall research efforts. Thanks to the diversity of the data, you can lean on a handful of different forms to arrive at meaningful insights. This flexibility enables you to design robust data strategies that are closely aligned with research objectives.
But it also means, that you'll need a qualitative coding system to analyze the data consistently, to get the most out of your diverse findings.

How to collect qualitative data
Coding qualitative data effectively starts with having the right data to begin with. Here are a few common sources you can turn to to gather qualitative data for your research project:
Interviews: Conducting structured, semi-structured, or unstructured interviews with individuals or groups is a great way to start. With these you can gather in-depth insights about experiences, opinions, and perspectives. Interviews can be face-to-face, over the phone, or done with video calls.
Focus Groups: This involves bringing together a small group of participants to engage in discussions facilitated by a moderator. Focus groups allow researchers to explore group dynamics, shared experiences, and diverse viewpoints.
Surveys: Design open-ended survey questions to capture qualitative responses from respondents. Surveys can be distributed through email, online platforms, or in-person interviews to gather large volumes of qualitative data.
Observations: Arranging sessions to systematically observe and record behaviours in a particular setting is a great qualitative data source. Observations can be participant-based (the researcher actively participates) or non-participant (the researcher observes without interference).
Document Analysis: You can review existing documents, texts, artifacts, or media sources to extract qualitative insights from them. Documents could be written reports, social media posts, customer reviews, historical records, among other things.
Diaries or Journals: Ask participants to maintain personal diaries or journals to record their thoughts, experiences, and reflections over a specific period. Diaries provide rich, real-time qualitative data about daily life and emotions.
Ethnography: Immersing yourself in participants' natural environments or cultural contexts to observe social behaviours or norms. Ethnographic studies aim to gain deep cultural insights from a particular group.
Each insight collection method offers unique advantages and challenges when it comes to your research objectives.
The key in picking your method, is to align data types and collection with your research goals as much as possible to ensure the data is rich, and will remain relevant to your research questions.
What are the different types of coding?
Before we dive into the specifics around different methods to code qualitative data, let's start with the most basic understanding of research approaches. In general, there are two: inductive and deductive coding.
Inductive coding is ideal for exploratory research, when the goal is to develop new theories, ideas or concepts. It allows the data to speak for itself.
Deductive coding, on the other hand, is better suited when the researcher has a pre-determined structure or framework they need to fit the data into, such as in program evaluation or content analysis studies.
The key difference between these two approaches is that with deductive coding, you start with a framework of pre-established codes, which you use to label all the data that comes through your research project.

Deductive coding example
Say a researcher wanted to determine the answer to the research question –– what are the main factors that influence customer satisfaction with an e-commerce website?
Using deductive coding, you would develop a set of pre-determined codes based on existing theories and research on customer satisfaction with e-commerce websites. They might include, "website usability," "pricing," "product selection," or "customer service."
The researcher then collects the qualitative data, like customer interviews or open-ended survey responses about their experiences using the e-commerce website. The pre-defined codes provide a guide with which you would systematically categorize the data according to the most relevant category.
Once all the data is coded, you can analyze the frequency and relationships between the different codes to identify the key factors influencing customer satisfaction. You may find, for example, that website usability and shipping/delivery are the most prominent factors driving satisfaction.
This deductive approach helps in testing existing theories and frameworks around e-commerce customer satisfaction. It provides a structured way to analyze the data, and answer the research question.

Inductive coding example
Inductive coding operates with a different mindset when it comes to qualitative data analysis. Instead of starting with a pre-defined set of codes, the researcher reads through interview transcripts and begins to identify emerging themes and patterns in the data. This is distinct from the 'bottom-up' deductive approach.
Let's say your research question is –– what are the key factors that influence job satisfaction among software engineers?
With this approach, you could collect your qualitative data through interviews with software engineers to hear about their experiences and perceptions about job satisfaction. As you analyze your qualitative data, you start to identify pattern and themes from the data itself, capturing them into codes. These might be "work-life balance," "career development," or "team culture".
With inductive coding, the codes you use are grounded in the actual language and perspectives of the participants. The advantage here is that the data guides the analysis, rather than trying to fit the data into pre-existing assumptions or frameworks. This typically leads to better research outcomes, as real-world experiences and perspectives of the participants ground the insights.

Qualitative coding methods
Now that we know the main ways of assigning codes, let's dive a bit deeper to understand more granular methods.
When it comes to choosing a method to structure and analyze your data, your first criteria should be to align the method with your research goals. It's also worth noting that using multiple complementary methods (triangulation) can provide more robust analysis.
In this section, let's explore a range of qualitative coding methods. Each offers unique perspectives to help you unlock the most meaning from your qualitative data.
Thematic Analysis Coding
Thematic analysis coding is your go-to method when you want to uncover recurring patterns and themes across your qualitative data.
Imagine you're knee-deep in interview transcripts from customer feedback sessions. You start noticing phrases like "user-friendly interface" or "quick issue resolution" popping up frequently. These phrases are your themes. By coding them under relevant categories like "Ease of Use" or "Efficient Support," you're essentially organizing your data in a way that makes sense. This method works wonders when you have a large volume of qualitative data and need to distill it into manageable themes for deeper analysis.
Pattern Coding
Pattern coding is all about spotting and grouping similarly coded excerpts under one overarching code to describe a pattern.
Let's say you're analyzing customer reviews of a new mobile app. You notice phrases like "love the design but slow loading times" or "great features, needs smoother navigation." These phrases share a common thread—the balance between design and functionality. By creating a pattern code like "Design-Functionality Balance," you capture the essence of these comments without losing their individual insights. This method helps you identify trends or issues that might go unnoticed otherwise.
Focused/Selective Coding
Focused or selective coding comes into play when you've completed an initial round of "open coding" and need to refine your codes further.
Picture yourself swimming in a sea of codes derived from open-ended survey responses. You've identified several themes but want to narrow them down to the most relevant ones. Focused coding helps you create a finalized set of codes and categories based on your research objectives. This method is like streamlining your focus, ensuring that every code you use aligns directly with your study's purpose.
Axial Coding
Axial coding is your tool for connecting the dots between codes or categories, unveiling relationships and links within your data.
Imagine you've coded various customer sentiments about a product launch. Some codes relate to pricing satisfaction, while others focus on feature preferences. Axial coding helps you see how these codes intersect—are customers who like certain features more forgiving about pricing, or vice versa? This method dives deep into understanding the interconnectedness of different aspects of your qualitative data.
Theoretical Coding
Theoretical coding lets you build a conceptual framework by structuring codes and categories around emerging theories or concepts.
Imagine you're studying employee satisfaction in a company undergoing digital transformation. Your codes reveal sentiments about adapting to new tools, workload changes, and management support. Theoretical coding helps you map these codes to existing theories like Herzberg's Two-Factor Theory or Maslow's Hierarchy of Needs, adding layers of theoretical understanding to your qualitative analysis.
Elaborative Coding
Elaborative coding is about applying previous research theories or frameworks to your current data and observing how they align or differ.
Let's say your study on customer loyalty echoes findings from established loyalty models like the Loyalty Pyramid. Elaborative coding helps you validate these connections or identify nuances that existing models might overlook. It's like having a conversation between your data and established theories, enriching your analysis with broader industry perspectives.
Longitudinal Coding
Longitudinal coding is crucial when you're tracking changes or developments in qualitative data over time.
Imagine you're studying consumer perceptions of a brand across multiple years. Longitudinal coding allows you to compare sentiments, identify shifts in customer preferences, and track the impact of marketing campaigns or product changes. This method provides a dynamic view of your data's evolution, helping you stay current and adaptive in your research insights.

In Vivo Coding
In vivo coding involves summarizing passages into single words or phrases directly extracted from the data itself.
Say you're analyzing focus group transcripts about online shopping experiences. Participants mention phrases like "cart abandonment blues" or "scroll fatigue." In vivo coding captures the essence of these experiences using participants' own language. It's about letting your data speak for itself, preserving the authenticity and nuances of participants' voices.
Process Coding
Process coding uses gerund codes to describe actions or processes within your qualitative data.
For example, let's say you're studying customer support interactions. Your codes highlight actions like "resolving complaints," "escalating issues," or "navigating knowledge bases." Process coding helps you dissect complex interactions into actionable steps , making it easier to analyze workflows, identify bottlenecks, or pinpoint areas for improvement.
Open Coding
Open coding kicks off your qualitative analysis journey by allowing loose and tentative coding to identify emerging concepts or themes.
Imagine you're starting interviews for a market research project. Open qualitative coding lets you tag responses with codes like "price concerns," "product satisfaction," or "brand loyalty." It's like casting a wide net to capture diverse customer insights , setting the stage for more focused coding and deeper analysis down the road.

Qualitative data software tools
When it comes to qualitative research and doing qualitative data analysis , having the right tools can make all the difference.
There are a plethora of qualitative data analysis software available to help make interpretation a lot easier –– using both deductive and inductive coding techniques. The choice of your tools depends on the specific needs of your research project, your familiarity to navigate it, and the level of complexity required. Keep in mind that many researchers find it beneficial to use a combination of tools at different stages of the research process.
Below are some factors to consider when deciding on a tool:
Ability to code and categorize data (both inductively and deductively)
Tools for identifying themes, patterns, and relationships in the data
Visualization capabilities to help explore and present findings
Support for diverse data types (text, audio, video, images)
Collaboration and reporting capabilities
Ease of use and intuitive interface
Qualitative data coding is not just about assigning labels, it's about uncovering stories, emotions, and valuable insights hidden within your qualitative research data. By using a blend of the coding methods such as thematic analysis, pattern coding, and in vivo coding, your can get to the heart of your customers' narrative, and unearth ways to serve them better.
Ready to unlock the full potential of your qualitative research journey? Get the tools, techniques, and strategies you need with Kapiche –– eliminate costly manual coding, and achieve meaningful, inductive insights fast. Check out a demo of Kapiche today to explore how it can help.
You might also like

Extract insights from Customer & Employee Interviews. At Scale.
Data coding in qualitative research: a step-by-step guide.
Home » Data coding in qualitative research: A step-by-step guide
Qualitative Data Coding serves as a crucial technique in qualitative research, transforming raw data into actionable insights. Researchers often collect vast amounts of unstructured information through interviews, focus groups, or other methods. Without effective coding, this rich data can become overwhelming and difficult to analyze. Qualitative Data Coding provides a systematic approach to categorize and interpret this information, uncovering meaningful patterns and themes that emerge from respondents' experiences.
This process not only helps in organizing data but also facilitates deeper understanding and comparison across different data sets. By assigning labels or codes to various segments of data, researchers can efficiently navigate through responses and draw relevant conclusions. As we move forward in this guide, we will explore detailed steps and strategies to enhance your skills in Qualitative Data Coding, empowering you to uncover valuable insights from your research endeavors.
Understanding Qualitative Data Coding
Qualitative Data Coding is a systematic process that transforms raw qualitative information into organized, analyzable data. This approach enables researchers to identify patterns, themes, and narratives within the data, providing richer insights into human behavior and experiences. Understanding the nuances of this coding process is crucial for successfully interpreting the greater context behind participants' responses.
To effectively grasp qualitative coding, one should consider several key steps. First, familiarize yourself with the different coding techniques—such as open, axial, and selective coding. Each technique serves unique purposes and can enhance analytical depth. Second, ensure that a clear coding framework aligns with your research questions. A well-structured framework aids in maintaining consistency throughout your analysis. Finally, continuously refine your codes as new insights emerge, allowing your research to be adaptive and responsive to the data collected. This iterative approach will contribute significantly to a comprehensive understanding of qualitative data, enriching the overall research findings.
The Importance of Qualitative Data Coding in Research
Qualitative Data Coding plays a pivotal role in transforming raw information into meaningful insights. By systematically organizing this type of data, researchers can identify patterns, themes, and core concepts that inform their analyses. This process enhances the overall quality and reliability of research findings, making it an essential component of qualitative work.
Moreover, qualitative coding helps ensure consistency and accuracy in data interpretation. It allows researchers to group similar information, making it easier to analyze large volumes of qualitative data, such as interviews or open-ended survey responses. When conducted correctly, qualitative data coding not only clarifies the data but also reveals deeper insights that may not be immediately obvious. The structured approach fosters a more robust understanding of participants' perspectives, enriching the research outcomes and providing valuable guidance for decision-making.
Key Concepts in Qualitative Data Coding
Qualitative Data Coding is essential for transforming raw qualitative data into meaningful insights. This process involves identifying themes, patterns, and categories from diverse data sources such as interviews, focus groups, and open-ended survey responses. The first key concept in qualitative data coding is open coding, where researchers assign initial labels to segments of data. This enables them to recognize significant themes as they emerge in the text.
After open coding, researchers engage in axial coding, which refines and correlates these initial codes into broader categories. This helps in developing a more structured understanding of the data. Finally, selective coding focuses on integrating the categorized data to form a coherent narrative that answers the research questions. Overall, a systematic approach to these coding types enhances the accuracy and depth of qualitative analysis, leading to actionable insights. Understanding these concepts is critical for anyone involved in qualitative research.
Steps in the Qualitative Data Coding Process
The qualitative data coding process consists of several key steps that help researchers derive meaningful insights from text or interview data. Initially, researchers must familiarize themselves with the data by reading and re-reading transcripts or notes. This step aids in identifying recurring themes, concepts, or patterns that warrant further exploration. Next, coding involves assigning labels or tags to these themes, allowing researchers to categorize the information systematically.
Following the coding, it is crucial to review and refine these codes to ensure accuracy and consistency. Researchers can then group similar codes into broader categories, which facilitates the organization of data into a coherent narrative. Finally, the coded data can be analyzed and interpreted, resulting in actionable insights. Each step is essential for effective qualitative data coding, ensuring a thorough understanding of the underlying meanings within the data collected.
Preparing Your Data for Coding
Preparing your data for coding is a crucial step in the qualitative data coding process. Begin by gathering all relevant materials, which can include transcripts, notes, and articles. Ensure that these documents are organized and formatted consistently to facilitate smoother analysis. Use a project management tool to maintain clarity and structure as you import data from various sources.
Next, familiarize yourself with the content you'll be coding. Read through each document to identify key themes and concepts. Highlight or annotate significant quotes and insights that might inform your coding framework. This understanding will serve as a valuable foundation as you transition into the coding phase. Ultimately, the objective is to create an accessible and well-prepared dataset that enhances your ability to uncover patterns and themes in your research findings.
Initial Coding: Creating Categories
Initial coding is a crucial phase in qualitative data coding, where researchers begin to organize raw data into meaningful categories. This process involves reviewing transcripts, notes, or other documents to identify recurring themes or significant patterns. By breaking down the data into manageable parts, researchers can create initial codes that represent key concepts or ideas.
During initial coding, it’s helpful to follow specific steps to maintain focus and clarity. First, familiarize yourself with the data by reading it thoroughly. Second, highlight terms or phrases that stand out and resonate with your research objectives. Third, categorize these highlighted items into broader themes based on their similarities. Finally, label each category with a descriptive name that encapsulates its essence. This systematic approach not only aids in data organization but also enhances the overall analysis process, ensuring that crucial insights are not overlooked.
Axial Coding: Identifying Themes
Axial coding is a pivotal step in qualitative data coding, helping researchers refine and interconnect initial codes. At this stage, the aim is to identify central themes that emerge from gathered data, transforming raw information into coherent concepts. This process involves grouping related data excerpts and examining their relationships to ensure a robust understanding of the core issues.
To effectively conduct axial coding, follow these steps:
- Identify Core Categories : Examine the initial codes and determine central themes.
- Organize Data : Reassemble the data around these themes, creating a framework for analysis.
- Explore Relationships : Investigate how different themes interact, helping to reveal patterns and insights.
- Refine Codes : Continuously update and refine codes based on the evolving understanding of the data.
This systematic approach clarifies the narrative within the data, enhancing the depth and quality of qualitative analysis. In turn, it allows researchers to derive reliable insights that inform further studies or practical applications.
Advanced Techniques in Qualitative Data Coding
Advanced techniques in qualitative data coding enhance understanding and interpretation of qualitative research data. By applying these strategic approaches, researchers can identify patterns and themes that might initially go unnoticed. Effective data coding allows for more nuanced insights, fostering a comprehensive analysis that supports robust findings.
One key technique is thematic coding , where researchers categorize data by identifying overarching themes. Another important method is in vivo coding , which utilizes participants' own words to maintain authenticity and context. Additionally, using mixed coding methods can combine approaches for richer analysis. Lastly, collaborative coding encourages multiple researchers to analyze data collectively, enhancing reliability and integrating diverse perspectives. Each technique contributes uniquely to qualitative data coding, enriching the overall research process and outcomes. Such advanced strategies ensure that insights derived are not only detailed but also meaningful to the study's objectives.
Selective Coding: Refining Themes
Selective coding is a vital aspect of qualitative data coding that allows researchers to refine and consolidate identified themes. At this stage, you will focus on the central categories that emerged during preliminary coding, ensuring they accurately reflect the data. Engaging with this process helps illuminate connections among different themes, revealing deeper insights that may not have been apparent initially.
To effectively carry out selective coding, follow these key steps:
Identify Core Categories : Review the themes identified during earlier coding stages, focusing on those that are most relevant to your research questions.
Group Related Themes : Combine themes that share commonalities, creating broader categories to simplify and clarify the findings.
Review and Revise : Continuously revisit these categories to ensure they remain true to the data and reflect any new insights gained during analysis.
Develop a Narrative : Formulate a compelling story that integrates your core categories, helping convey the significance of your findings in a coherent manner.
This approach enhances the clarity and impact of your qualitative findings, ultimately contributing to a more robust analysis.
Ensuring Rigor in Qualitative Data Coding
Ensuring rigor in qualitative data coding is essential for the credibility of research findings. One effective approach is to establish clear coding guidelines before beginning the analysis. This includes determining code definitions and ensuring they align closely with the research questions. A second key aspect is maintaining consistency across coding efforts. Involving multiple coders can help validate the coding process, but it’s important to hold calibration sessions to align their interpretations.
Furthermore, revisiting the data and codes regularly during analysis fosters a deeper understanding of the emerging themes. This iterative process allows researchers to refine codes as new insights come forward. Lastly, using tools that support transparency in coding decisions can enhance rigor. Documenting code applications and interpretations helps ensure that qualitative data coding stands up to scrutiny and supports robust conclusions, empowering researchers to confidently communicate their findings.
Conclusion: Mastering Qualitative Data Coding in Your Research
Mastering qualitative data coding is essential for researchers aiming to extract meaningful insights from their data. This process involves categorizing, comparing, and interpreting qualitative information, allowing researchers to uncover themes and patterns that may not be immediately visible. Through effective coding, researchers can transform raw data into structured findings that can inform decisions and enhance understanding.
Embracing qualitative data coding requires practice and an awareness of potential biases. By employing systematic coding techniques, researchers can ensure a more objective analysis. Ultimately, mastering this skill will not only improve the quality of your research but also empower you to communicate your findings more clearly and convincingly to your audience.
Turn interviews into actionable insights
On this Page
Coding for qualitative research: AI-powered tools
You may also like, guide to designing a website user journey map.

7 Usability Testing Methods to Improve User Experience
Top 5 free ux research tools to use in 2024.
Unlock Insights from Interviews 10x faster
- Request demo
- Get started for free
Qualitative Data Coding
Saul McLeod, PhD
Editor-in-Chief for Simply Psychology
BSc (Hons) Psychology, MRes, PhD, University of Manchester
Saul McLeod, PhD., is a qualified psychology teacher with over 18 years of experience in further and higher education. He has been published in peer-reviewed journals, including the Journal of Clinical Psychology.
Learn about our Editorial Process
Olivia Guy-Evans, MSc
Associate Editor for Simply Psychology
BSc (Hons) Psychology, MSc Psychology of Education
Olivia Guy-Evans is a writer and associate editor for Simply Psychology. She has previously worked in healthcare and educational sectors.
Coding is the process of analyzing qualitative data (usually text) by assigning labels (codes) to chunks of data that capture their essence or meaning. It allows you to condense, organize and interpret your data.
A code is a word or brief phrase that captures the essence of why you think a particular bit of data may be useful. A good analogy is that a code describes data like a hashtag describes a tweet.

Coding is an iterative process, with researchers refining and revising their codes as their understanding of the data evolves.
The ultimate goal is to develop a coherent and meaningful coding scheme that captures the richness and complexity of the participants’ experiences and helps answer the research questions.
Step 1: Familiarize yourself with the data
- Read through your data (interview transcripts, field notes, documents, etc.) several times. This process is called immersion.
- Think and reflect on what may be important in the data before making any firm decisions about ideas, or potential patterns.
Step 2: Decide on your coding approach
- Will you use predefined deductive codes (based on theory or prior research), or let codes emerge from the data (inductive coding)?
- Will a piece of data have one code or multiple?
- Will you code everything or selectively? Broader research questions may warrant coding more comprehensively.
If you decide not to code everything, it’s crucial to:
- Have clear criteria for what you will and won’t code
- Be transparent about your selection process in research reports
- Remain open to revisiting uncoded data later in analysis
Step 3: Do a first round of coding
- Go through the data and assign initial codes to chunks that stand out
- Create a code name (a word or short phrase) that captures the essence of each chunk
- Keep a codebook – a list of your codes with descriptions or definitions
- Be open to adding, revising or combining codes as you go
Descriptive codes
- In vivo coding / Semantic coding : This method uses words or short phrases directly from the participant’s own language as codes. It deals with the surface-level content, labeling what participants directly say or describe. It identifies keywords, phrases, or sentences that capture the literal content. Participant : “I was just so overwhelmed with everything.” Code : “overwhelmed”
- Process coding : Uses gerunds (“-ing” words) to connote observable or conceptual action in the data. Participant : “I started by brainstorming ideas, then I narrowed them down.” Codes : “brainstorming ideas,” “narrowing down”
- Open coding : A form of initial coding where the researcher remains open to any possible theoretical directions indicated by the data. Participant : “I found the class really challenging, but I learned a lot.” Codes : “challenging class,” “learning experience”
- Descriptive coding : Summarizes the primary topic of a passage in a word or short phrase. Participant : “I usually study in the library because it’s quiet.” Code : “study environment”
Step 4: Review and refine codes
- Look over your initial codes and see if any can be combined, split up, or revised
- Ensure your code names clearly convey the meaning of the data
- Check if your codes are applied consistently across the dataset
- Get a second opinion from a peer or advisor if possible
Interpretive codes
Interpretive codes go beyond simple description and reflect the researcher’s understanding of the underlying meanings, experiences, or processes captured in the data.
These codes require the researcher to interpret the participants’ words and actions in light of the research questions and theoretical framework.
For example, latent coding is a type of interpretive coding which goes beyond surface meaning in data. It digs for underlying emotions, motivations, or unspoken ideas the participant might not explicitly state
Latent coding looks for subtext, interprets the “why” behind what’s said, and considers the context (e.g. cultural influences, or unconscious biases).
- Example: A participant might say, “Whenever I see a spider, I feel like I’m going to pass out. It takes me back to a bad experience as a kid.” A latent code here could be “Feelings of Panic Triggered by Spiders” because it goes beyond the surface fear and explores the emotional response and potential cause.
It’s useful to ask yourself the following questions:
- What are the assumptions made by the participants?
- What emotions or feelings are expressed or implied in the data?
- How do participants relate to or interact with others in the data?
- How do the participants’ experiences or perspectives change over time?
- What is surprising, unexpected, or contradictory in the data?
- What is not being said or shown in the data? What are the silences or absences?
Theoretical codes
Theoretical codes are the most abstract and conceptual type of codes. They are used to link the data to existing theories or to develop new theoretical insights.
Theoretical codes often emerge later in the analysis process, as researchers begin to identify patterns and connections across the descriptive and interpretive codes.
- Structural coding : Applies a content-based phrase to a segment of data that relates to a specific research question. Research question : What motivates students to succeed? Participant : “I want to make my parents proud and be the first in my family to graduate college.” Interpretive Code : “family motivation” Theoretical code : “Social identity theory”
- Value coding : This method codes data according to the participants’ values, attitudes, and beliefs, representing their perspectives or worldviews. Participant : “I believe everyone deserves access to quality healthcare.” Interpretive Code : “healthcare access” (value) Theoretical code : “Distributive justice”
Pattern codes
Pattern coding is often used in the later stages of data analysis, after the researcher has thoroughly familiarized themselves with the data and identified initial descriptive and interpretive codes.
By identifying patterns and relationships across the data, pattern codes help to develop a more coherent and meaningful understanding of the phenomenon and can contribute to theory development or refinement.
For Example
Let’s say a researcher is studying the experiences of new mothers returning to work after maternity leave. They conduct interviews with several participants and initially use descriptive and interpretive codes to analyze the data. Some of these codes might include:
- “Guilt about leaving baby”
- “Struggle to balance work and family”
- “Support from colleagues”
- “Flexible work arrangements”
- “Breastfeeding challenges”
As the researcher reviews the coded data, they may notice that several of these codes relate to the broader theme of “work-family conflict.”
They might create a pattern code called “Navigating work-family conflict” that pulls together the various experiences and challenges described by the participants.

- Customer Feedback Analytics
- Integrations
- Data Sources
- Marketing Intelligence
- Sentiment Analysis
- Ticket Driver Report
- AI Chatbot Preparation
- For Voice of Customer Teams
- For Product Operations Teams
- For Customer Support Teams
- For Customer Experience Teams
- Our Story and Team
- Customer Reviews
- Partner Program
- Start for Free
- Request Demo
Actionable guide for coding qualitative data

Calculating a Net Promoter Score (NPS) or similar numerically based surveys for your business is easy because numerical data is easy to add, average, and summarize. These can be easily calculated and averaged to create benchmarks and measure business growth. When you throw qualitative data (non-numerical feedback) into the mix, however, it’s less easy to analyze and summarize on its own without a customer feedback management platform or detailed, manual summary analysis of the data.
This is why developing a system for coding qualitative data, so it’s numbers or category-based, is helpful. Once quantified, this data can be used to interpret things like interview answers, reviews, and comments into meaningful, actionable results.
In this guide, we discuss coding qualitative data, including:
What is qualitative data?
What is data coding in qualitative research, steps for a qualitative data analysis, how do you code qualitative data in excel, bonus tips for quantifying qualitative data, what is the fastest way to code qualitative data, focus groups, record keeping, observation, longitudinal studies, case studies (storytelling or narratives), deductive coding, inductive coding, grounded theory, hierarchical coding frames, examples of qualitative data coding, step 1: create high-level categories, step 2: assign sentiments, step 3: combine and analyze, step 1: set up your spreadsheet, step 2: create your master list of category tags, step 3: add qualitative data, step 4: assign categories to data, step 5: assign sentiments, step 6: combine and average category ratings.
Qualitative data is non-numerical data feedback. It comes from written, audio, or imagery responses. Here’s an example of how the same question can be asked in 2 different ways, resulting in qualitative data and quantitative data:
- Qualitative : Tell us about your satisfaction with our software.
- Quantitative : Rate your satisfaction with our software on a scale from 1-10.
Most surveys will ask both qualitative and quantitative questions to collect more detailed data. And while it provides helpful, detailed information, the qualitative data analysis is not as quick to summarize and analyze afterwards without being quantified in some way, whether that be by manual analysis or using customer insight software . This is why brands are using qualitative data coding to better understand customer feedback.
Types of qualitative research
There are many types of qualitative research methods. Here are six popular ways to collect the qualitative data from your customers:
In interviews, you ask the respondent open-ended questions and record their answers. These often require a more personal approach and are best performed by a third party to avoid hesitation or biased responses.
In group settings, limit focus groups to six to ten people and use a third-party moderator for transparency.
Look for other sources of information to use in your qualitative data analysis. This could include customer records, purchase history, and other customer data you have legally obtained or collected.
This is when you or a third party observes your customers using the product and records what they observe (either by writing down or recording video or audio). Ethically, the customers should know they are being observed and for what purpose.
This is a longer-form research style where you collect data from the same source and conditions over a longer period. An example of this is medical studies that measure patients’ response to a drug over the long term.
You collect data from case studies to make empirical observations and draw inferences. This helps you understand the entire lifespan of a customer, including:
- Their key pain points
- Why they chose your product
- How they use(d) your product
- Why they would or would not recommend it to others.
The easiest raw data to collate, analyze and summarize is quantitative data; however, we can still use thematic analysis when coding qualitative data to help us come to the same, if not more detailed, conclusion and summary. When you identify themes from your data, you can put your qualitative responses into buckets of similar feedback to dive deeper into areas of your business or offerings that really need help.
In qualitative research, “coding data” means assigning categories or values to each written or observed response. These values can then be added and averaged to determine an accurate overall representation of each area of your business that you are analyzing.
For example, you could ask one of two questions:
- Are you happy with your product or service? (Answers to include either yes/no or a satisfaction rating scale.)
- Tell us about your experience using our product. (The response is open-ended.)
When you ask the first type of question you’ll get a high-level “yes, we like your product” or “no, we don’t” type of response. While this data is helpful, it doesn’t indicate what it is about the product that people like or don’t like.
When you ask open-ended survey questions, you can get more detailed responses about why they’re satisfied or dissatisfied with your offering. They may point out a feature that doesn’t work as advertised (which you can now fix) or that the long wait time to reach a customer service rep through the chat box on your website has prevented them from using your product to its full potential.
Coding frameworks and methodology
Your methodology used for coding qualitative data will impact the level of detail and results you achieve. The more specific your qualitative data coding is, the more detail you’ll uncover.
Here are some common qualitative research coding frameworks:
A deductive approach to coding qualitative data works best when you have sound foundational tags and categories in place. With deductive methods, you use the data you have to look for patterns, develop a hypothesis, and write your theory.
Deductive coding works great for annual survey data because you can use the same tags as the previous year as your benchmark and compare it to current results. You can also choose to combine your deductive coding with inductive coding.
With inductive methods, you create a theory that you test, observe, and confirm. Inductive coding is best for your first round of analysis to help you determine the tags that’ll be of the highest value. This will be a lengthier process than deductive coding, but it’s an essential first step to getting the foundational data and labels you need for more in-depth coding and thematic analysis of your data.
Inductive coding also works best when you have scale measurements or are analyzing large amounts of qualitative data you haven’t analyzed before. Without qualitative coding software, it requires manually reviewing the data, which is why inductive coding takes so long.
Another way to code data is using a grounded theory. This is when you develop a theory based on data from a single customer. Your theory is “grounded” in real customer data, and you can test your theory by expanding your analysis to additional customers. This will help you determine if your theory is statistically applicable to a larger population of customers, or is an isolated case.
Your coding method can be as basic as determining a positive or negative sentiment towards a specific tag or category. It can also be tagged to understand specific reasons for that sentiment. There’s no right or wrong way to do this. It all depends on how much specificity and detail you want.
For example, when coding the sentiments of your product or service offering, Level 1 is the category tag you are analyzing. Level 2 is the sentiment (either positive or negative). The final level goes into more detail about why the respondent chose that sentiment. This is a tagset that you may not be able to create until you’ve analyzed at least some of the data (unless you already know this information from previous research, customer feedback , or grounded theories).
There are different ways of coding qualitative data. Here are some examples:
- In Vivo Coding : Coding is based on the participant’s words, not your own interpretation. For example, if the response includes emotional words to describe how they feel about your product, use those exact words as your tags.
- Process Coding : This helps understand people’s processes or steps. For example, if someone is describing how they use your software product to get their end result, they may explain actions (usually using “ing”) words. Use each “step” they describe as a tag to analyze the sentiment related to that step.
- Descriptive Coding : This analysis includes the analyst summarizing the response into a description. You then code the qualitative data based on a keyword or noun in that description.
- Values Coding : You take your qualitative data and create codes according to values, attitudes or beliefs.
- Simultaneous Coding : This is when a single open-ended response will correspond to several category codes. This is common in written testimonials and reviews. For example, a customer writes the following review: “I love this product. The features and customer support were outstanding.” This references an overall positive sentiment about the product and high ratings for the features and customer support. To capture this detailed data, this would be tagged with three predefined codes: product sentiment, product features, and customer service.
If you are coding qualitative data manually, there are three basic steps to code the data:
Assign the categories of data you want to analyze. For example, if you’re doing an annual survey for the purposes of understanding customer sentiment and satisfaction with your company and its offerings, you may choose some of these tags (or others based on your type of business):
- Product features
- Customer support
To quantify qualitative data in this situation, apply a sentiment to each response. Start small and tag as either positive, negative, or neutral sentiments. At a fundamental level, people will either be happy, unhappy, or neutral about a feature or interaction with your brand.
Read each response and determine if this is a happy customer, a dissatisfied customer, or someone who doesn’t seem to care one way or the other. If you are unsure, code this answer as “Neutral.”
As you dive deeper into your data, you can expand on these three basic sentiments to make a full rating scale of responses which may, for example, include a rating scale for sentiment:
- Highly dissatisfied
- Somewhat dissatisfied
- Somewhat satisfied
- Very satisfied
Now that you have finished the coding process and have assigned sentiments or ratings to your qualitative data, you can use this information to generalize your data and look for trends.
For example:
- If you notice that you have primarily negative sentiments, you can deduce that people are generally unsatisfied with your brand or offerings. Then you can read deeper into the data to see the areas they are dissatisfied with and make changes to increase customer satisfaction.
- If you notice people are indicating an indifference in their responses (mostly threes on your coding scale), perhaps these are customers who may leave soon because you’re not giving them the solution to their problem. You can analyze the data deeper to determine how to increase customer satisfaction to increase the Average Customer Lifetime value and duration, thus improving your sentiment scores in your next survey.
You can also combine your qualitative data results with any quantitative data you may have to provide a more detailed analysis of your survey results .
Using spreadsheet software like Excel or Google Sheets for coding qualitative data works well due to the software’s built-in calculative abilities.
Here’s an example of how to code qualitative data based on written Google reviews in a spreadsheet:
Start by adding your column headings to your spreadsheet. Basic qualitative analysis requires three columns. In this case, it’ll be your written Google review, the category tags you want to assign, and a sentiment rating or score.
We suggest starting with just 3-5 tags at the maximum to get started. For ease and consistency, use the dropdown list functionality in Excel ( Data Validation in Google Sheets). Add a dropdown list of multi-select options for each category in Column B.
Your spreadsheet should look similar to this:

Now you are ready to begin adding your Google reviews to the spreadsheet. Add one review per cell in Column A:
In written responses like Google Reviews, one reviewer may mention several categories. For best results, highlight each category and include in the dropdown in column B:
Assign each piece of feedback a sentiment using a rating scale of your choosing . We usually find that 1-3 (Unhappy, Neutral, Happy) works well, but feel free to expand that to a rating system of 5 if you want more granular feedback.
Next, you want to look at each category individually to see which areas need improvement and which are performing well.
In the above example, calculate your average score percentage:
- Product Feedback: 5/5 + 3/5 = 4/5 average
- Price Feedback: 3/5 + 4/5 = 3.5/5 average
- Customer Service: 5/5 + 5/5 = 5/5 average
This tells us that your company has an excellent reputation for its customer service, but perhaps pricing could be improved to attract more customers. The product satisfaction rating is a good 80%, with room for improvement based on a deeper analysis of why customers don’t think your product is perfect.
While collecting and interpreting qualitative data, here are some tips to ensure your results are as accurate as possible:
Start Small
It’s best to test your qualitative coding and analysis on small sample sets before dedicating more considerable resources to your research. Start with a couple of high level category tags and sample data and try your methods first. We suggest using 10-20% of your survey data for testing.
Use Scales
Consider ways to use rating scales when analyzing qualitative data rather than just recording sentiment. After all, humans are not just happy and sad for no reason. For example, if you get the response “I like the service, but feel it’s overpriced,” you could quantify that by either:
- They like the product (sentiment analysis)
- It’s a 3/5 because they don’t think this price is fair (scale analysis).
By using a scale, you now have quantitative data that you can average and summarize.
Track Multiples
Look at each question or dataset to see what other data you can infer or assume about the responses. For example, if you asked how they liked your restaurant’s food, they responded with, “It was tasty, but it could have been better if the waiter was more friendly.” This answer provides feedback on the food quality and the staff. Based on this, you can code their response into two categories with individual sentiments.
Don’t overdo your tags and categories. You can use tags to go deeper into interpreting qualitative data, but unless you have the resources to analyze this level of detail, it likely won’t be helpful for you. Machine learning algorithms like Idiomatic and AI can help you analyze and summarize more tags and data.
Create tags based on themes, not wording
In most cases, the specific wording someone uses to describe your shop as dirty doesn’t matter. The fact that people think your storefront is filthy-looking is enough data to inform a business change or decision. People may describe “dirty” as dusty, grimy, or filthy, but they all mean the same thing.
When coding qualitative data like this, look for one word to encompass the sentiment of dirty, not each individual term used to describe it.
Qualitative data analysis software or machine learning algorithms and AI programs (like Idiomatic ) are the fastest way to code qualitative data and present you with actionable results. It can also help you determine the more accurate tags and sentiment rules.
Idiomatic can take your qualitative data and use its robust machine learning algorithms to do the hard work for you. You can input any mix of research data into this qualitative coding software. Your qualitative data analysis is done in a machine-learned, systematic way to provide consistently reliable results every time you add new data.
To learn more about using Idiomatic as your qualitative data analysis software, request an Idiomatic demo today.
Request a demo

Chris Martinez
Co-Chief Executive Officer | Growth
Chris is obsessed with pushing Idiomatic to move faster in providing value to customers. Prior to Idiomatic, he co-founded Glow (15+ Million users, 40 countries). He has a BS in Math and Computer Science, a JD, and an MBA from Stanford. Outside of work, he can typically be found cooking, playing basketball (or really any other sport), or traveling with his wife and three children. His favorite quote is “fear is the mind-killer” from the novel Dune.
All-in-one Qualitative Coding Software
Start your free trial.
Free MAXQDA trial for Windows and Mac
Your trial will end automatically after 14 days and will not renew. There is no need for cancelation.
Elevate your qualitative research with cutting-edge Qualitative Coding Software
MAXQDA is your go-to solution for qualitative coding, setting the standard as the top choice among Qualitative Coding Software. This powerful software is meticulously designed to accommodate a diverse array of data formats, including text, audio, and video, while offering an extensive toolkit tailored specifically for qualitative coding endeavors. Whether your research demands data categorization, thematic visualization, mixed-methods analysis, or quantitative content examination, MAXQDA empowers you to seamlessly uncover the profound insights crucial for your qualitative research.
Document viewer
Your analysis.

Revolutionize Your Research: Unleash the Power of Qualitative Coding Software
Qualitative coding software is an essential companion for researchers and analysts seeking to delve deeper into their qualitative data. MAXQDA’s user-friendly interface and versatile feature set make it the ideal tool for those embarking on qualitative coding journeys. Its capabilities span across various data types, ensuring you have the tools required to effectively organize, analyze, and interpret your qualitative data.
Developed by and for researchers – since 1989
Having used several qualitative data analysis software programs, there is no doubt in my mind that MAXQDA has advantages over all the others. In addition to its remarkable analytical features for harnessing data, MAXQDA’s stellar customer service, online tutorials, and global learning community make it a user friendly and top-notch product.
Sally S. Cohen – NYU Rory Meyers College of Nursing
Qualitative Coding is Faster and Smarter with MAXQDA
MAXQDA makes qualitative coding faster and easier than ever before. Code and analyze all kinds of data – from texts to images and audio/video files, websites, tweets, focus group discussions, survey responses, and much more. MAXQDA is at once powerful and easy-to-use, innovative and user-friendly, as well as the only leading qualitative coding software that is 100% identical on Windows and Mac.
As your all-in-one Qualitative Coding Software, MAXQDA can be used to manage your entire research project. Easily import a wide range of data types such as texts, interviews, focus groups, PDFs, web pages, spreadsheets, articles, e-books, bibliographic data, videos, audio files, and even social media data. Organize your data in groups, link relevant quotes to each other, make use of MAXQDA’s wide range of coding possibilities for all kind of data and for coding inductively as well as deductively. Your project file stays flexible and you can expand and refine your category system as you go to suit your research.

Qualitative coding made easy
Coding qualitative data lies at the heart of many qualitative data analysis methods. That’s why MAXQDA offers many possibilities for coding qualitative data. Simply drag and drop codes from the code system to the highlighted text segment or use highlighters to mark important passages, if you don’t have a name for your category yet. Of course, you can apply your codes and highlighters to many more data types, such as audio and video clips, or social media data. In addition, MAXQDA permits many further ways of coding qualitative data. For example, you can assign symbols and emojis to your data segments.
Tools tailor made for coding inductively
Besides theory-driven qualitative data analysis, MAXQDA as an all-in-one qualitative coding software strives to empower researchers that rely on data-driven approaches for coding qualitative data inductively. Use the in-vivo coding tool to select and highlight meaningful terms in a text and automatically add them as codes in your code system while coding the text segment with the code, or use MAXQDA’s handy paraphrase mode to summarize the material in your own words and inductively form new categories. In addition, a segment can also be assigned to a new (free) code which enables researchers to employ a Grounded Theory approach.

Organize your code system
When coding your qualitative data, you can easily get lost. But with MAXQDA as your qualitative coding software, you will never lose track of the bigger picture. Create codes with just one click and apply them to your data quickly via drag & drop. Organize your code system to up to 10 levels and use colors to directly distinguish categories. If you want to code your data in more than one perspective, code sets are the way to go. Your project file stays flexible and you can expand and refine your category system as you go to suit your research.
Further ways of coding qualitative data
MAXQDA offers many more functionalities to facilitate the coding of your data. That’s why researchers all around the world use MAXQDA as their qualitative coding software. Select and highlight meaningful terms in a text and automatically add them as codes in your code system, code your material using self-defined keyboard shortcuts, code a text passage via color coding, or use hundreds of symbols and emoticons to code important text segments. Search for keywords in your text and let MAXQDA automatically code them or recode coded segments directly from the retrieved segments window. With the unique Smart Coding tool reviewing and customizing your categorization system never has been this easy.

Creative coding
Coding qualitative data can be overwhelming, but with MAXQDA as your qualitative coding software, you have an easy-to-use solution. In case you created many codes which in hindsight vary greatly in their scope and level of abstraction, MAXQDA is there to help. Creative coding effectively supports the creative process of generating, sorting, and organizing your codes to create a logical structure for your code system. The graphic surface of MAXMaps – MAXQDA’s tool for creating concept maps – is the ideal place to move codes, form meaningful groups and insert parent codes. Of course, MAXQDA automatically transfers changes made in Creative Coding Mode to your Code System.
Visualize your qualitative coding and data
As an all-in-one Qualitative Coding Software, MAXQDA offers a variety of visual tools that are tailor-made for qualitative research. Create stunning visualizations to analyze your material. Of course, you can export your visualizations in various formats to enrich your final report. Visualize the progression of themes with the Codeline, use the Word Cloud to explore key terms and the central themes, or make use of the graphical representation possibilities of MAXMaps, which in particular permit the creation of concept maps. Thanks to the interactive connection between your visualizations with your MAXQDA data, you’ll never lose sight of the big picture.

AI Assist: Qualitative coding software meets AI
AI Assist – your virtual research assistant – supports your qualitative coding with various tools. AI Assist simplifies your work by automatically analyzing and summarizing elements of your research project and by generating suggestions for subcodes. No matter which AI tool you use – you can customize your results to suit your needs.
Free tutorials and guides on qualitative coding software
MAXQDA offers a variety of free learning resources for qualitative coding, making it easy for both beginners and advanced users to learn how to use the software. From free video tutorials and webinars to step-by-step guides and sample projects, these resources provide a wealth of information to help you understand the features and functionality of MAXQDA as qualitative coding software. For beginners, the software’s user-friendly interface and comprehensive help center make it easy to get started with your data analysis, while advanced users will appreciate the detailed guides and tutorials that cover more complex features and techniques. Whether you’re just starting out or are an experienced researcher, MAXQDA’s free learning resources will help you get the most out of your qualitative coding software.

Free MAXQDA Trial for Windows and Mac
Get your maxqda license, compare the features of maxqda and maxqda analytics pro, faq: qualitative coding software.
When it comes to qualitative coding software, MAXQDA stands out as a top choice for researchers. MAXQDA is a comprehensive qualitative data analysis tool that offers a wide range of features designed to streamline the coding process and assist researchers in making sense of their qualitative data.
MAXQDA’s user-friendly interface and robust set of tools make it a reliable and powerful option for qualitative coding tasks, making it a popular choice among researchers.
One highly recommended software tool for coding qualitative data is MAXQDA. MAXQDA provides researchers with a set of tools for analyzing and interpreting their qualitative data, making it an excellent choice for qualitative coding tasks.
MAXQDA offers a range of features, including text analysis and data visualization, making it a comprehensive solution for qualitative data analysis.
Coding qualitative data involves systematically categorizing and labeling segments of your data to identify themes, patterns, and trends. MAXQDA simplifies this process by providing an intuitive interface and tools specifically designed for qualitative coding tasks.
To code qualitative data with MAXQDA, you typically follow these steps:
- Import your qualitative data into MAXQDA, such as interview transcripts, survey responses, or text documents.
- Read through your data to gain a deep understanding of the content.
- Identify keywords, phrases, or themes relevant to your research objectives.
- Create codes in MAXQDA to represent these keywords, phrases, or themes.
- Apply the created codes to specific segments of your data by highlighting or selecting the relevant text.
MAXQDA’s flexibility and organization features make it an excellent choice for coding qualitative data efficiently and effectively.
Qualitative coding methods are techniques used to analyze and categorize qualitative data. These methods help researchers make sense of the data and identify key themes, patterns, and insights. MAXQDA supports various qualitative coding methods, making it a versatile tool for researchers.
Some common qualitative coding methods include:
- Thematic Coding: This involves identifying and categorizing recurring themes or topics in the data.
- Content Analysis: Researchers analyze the content of the data to understand its meaning and context.
- Grounded Theory: A systematic approach to developing theories based on the data itself.
- Framework Analysis: A method for structuring and analyzing large amounts of qualitative data.
- Constant Comparative Analysis: Comparing new data with existing data to refine codes and categories.
MAXQDA’s tools and features are designed to support these coding methods, allowing researchers to choose the approach that best suits their research goals.
Qualitative coding is the process of systematically analyzing and categorizing qualitative data to identify patterns, themes, and insights. It involves assigning codes or labels to specific segments of qualitative data, such as interview transcripts, survey responses, or text documents. These codes help researchers organize and make sense of the data, facilitating data interpretation and the extraction of meaningful information.
MAXQDA is a valuable tool for qualitative coding as it provides researchers with the means to create, apply, and manage codes efficiently, allowing for a more structured and rigorous analysis of qualitative data.
For Mac users looking for qualitative coding software, MAXQDA is an excellent choice. MAXQDA offers a Mac version of its software that is fully compatible with macOS, providing Mac users with a seamless qualitative data analysis experience.
With MAXQDA for Mac, researchers can take advantage of all the features and capabilities that make MAXQDA a top choice in qualitative coding software. Whether you’re conducting research on a Mac computer or prefer the Mac environment, MAXQDA is a reliable and efficient solution.
For students venturing into qualitative research, MAXQDA is an ideal qualitative coding software choice. MAXQDA offers a user-friendly interface and a range of resources designed to support students in their research journey. It provides academic licenses at affordable prices, making it accessible to students on a budget.
MAXQDA’s intuitive design and comprehensive features empower students to code, analyze, and interpret qualitative data effectively. It also offers educational resources and tutorials to help students get started with qualitative research and coding.
Qualitative coding software, such as MAXQDA, offers a range of key features that are essential for effective qualitative data analysis. Some of the key features of qualitative coding software include:
- Code Management: The ability to create, organize, and manage codes for data segmentation.
- Data Import: The capability to import various types of qualitative data, including text, audio, and video files.
- Annotation Tools: Tools for adding comments, annotations, and notes to the data for context and analysis.
- Data Visualization: Graphs, charts, and visual aids to represent and explore data patterns.
- Search and Retrieval: Efficient search functions to locate specific data segments or codes within large datasets.
- Collaboration Tools: Features for collaborative coding and analysis with team members.
- Reporting and Export: The ability to generate reports, export data, and share findings with others.
MAXQDA excels in offering these features and more, making it a comprehensive solution for qualitative coding and analysis.
Qualitative coding software, like MAXQDA, plays a crucial role in assisting researchers with qualitative data interpretation. Here’s how:
1. Structure and Organization: Coding software helps researchers organize their qualitative data into manageable segments by assigning codes and categories. This structured approach facilitates easier data interpretation by breaking down complex information into meaningful units.
2. Pattern Recognition: By coding and categorizing data, researchers can quickly identify patterns, trends, and recurring themes. MAXQDA’s tools allow for easy visualization of these patterns, aiding in data interpretation.
3. Cross-Referencing: Qualitative coding software allows researchers to cross-reference data segments, codes, and categories. This cross-referencing helps in exploring relationships and connections within the data, leading to deeper insights.
4. Collaboration: Collaborative coding and analysis tools in software like MAXQDA enable researchers to work together, share interpretations, and refine their understanding of the data collectively.
In summary, qualitative coding software streamlines the process of data interpretation by providing tools and features that enhance the researcher’s ability to uncover meaningful insights from qualitative data.
Yes, qualitative coding software, including MAXQDA, is suitable for both beginners and experienced researchers. MAXQDA is known for its user-friendly interface, making it accessible to those who are new to qualitative research and coding.
For beginners, MAXQDA provides educational resources and tutorials to help them get started with qualitative data analysis. It offers a gentle learning curve, allowing novice researchers to quickly grasp the essentials of coding and analysis.
Experienced researchers benefit from MAXQDA’s advanced features and capabilities. It offers a robust set of tools for in-depth analysis, data visualization, and complex coding tasks. Researchers with extensive experience can leverage these features to enhance the rigor and depth of their qualitative research.
In essence, MAXQDA caters to researchers at all levels, making it a versatile choice for qualitative coding.
Qualitative coding can be done without software, but it can be a more time-consuming and labor-intensive process. When coding without software, researchers typically rely on manual methods such as highlighting, underlining, or physically tagging segments of printed text.
However, using qualitative coding software like MAXQDA offers several advantages. It streamlines the coding process, provides tools for efficient organization and retrieval of coded data, and offers features like data visualization and collaboration. These benefits can significantly enhance the quality and efficiency of qualitative coding.
While it’s possible to code qualitatively without software, utilizing a dedicated tool like MAXQDA can save researchers time and effort and lead to more rigorous and comprehensive data analysis.
This website uses cookies to ensure you get the best experience. Learn more about DOAJ’s privacy policy.
Hide this message
You are using an outdated browser. Please upgrade your browser to improve your experience and security.
The Directory of Open Access Journals
Quick search.
Ianna Journal of Interdisciplinary Studies (Aug 2024)
Can the Digital Software Method Outperform the Manual Method in Qualitative Data Analysis? Findings from a Quasi-experimental Research
- Ugochukwu Simeon Asogwa,
- Hannah Ifedapo Maiyekogbon,
- Margaret Offoboche Agada-Mba,
- Oluwaseyi John Jemisenia
Affiliations
Read online
Background: In the dynamic field of qualitative research, a contentious issue persists: Is digital software a more effective tool for research analysis than the manual method? To shed light on this debate, we undertook quasi-experimental research, focusing on our study's unique contribution to exploring the capabilities of both methods in analysing health datasets. Objective: Our study aims to compare the effectiveness of qualitative analysis between researchers who are proficient in digital software and those skilled in the manual method. We seek to understand which method is more effective in data analysis. Methodology: We employed a quasi-experimental design and a purposive sampling approach to select our study participants. These participants (n=150) were then divided into two groups: those proficient in digital software and those skilled in the manual method. We then conducted an intervention in which participants analysed a qualitative dataset using their preferred method. The data collected was then analysed using quantitative measures, such as percentages, central tendency measures, and independent samples t-tests. Results: The t-test result showed that statistically significant differences exist between the two groups across all indicators (all Ps<.0001). Specific observation of the mean scores revealed that for perceived efficiency (M=3.50 [SD=0.55]), productivity (M=3.40 [SD=0.60]), collaboration (M=3.55 [SD=0.50]), identification of complex themes (M=3.60 [0.45]), and visualisation techniques(M=3.60 [SD=0.45]), participants who used digital software scored higher than those who used manual method of data analysis. However, for perceived depth of analysis (M=3.50 [SD=0.55]), coding flexibility(M=3.45 [SD=0.50]), reflective quality(M=3.60 [SD=0.50]) and integration of contextual knowledge(M=3.55 [SD=0.45]), participants in the manual method group scored higher compared to those in the digital software group Contribution: This study adds to burgeoning and existing knowledge on the need for a complementary approach to adopting and using digital tools and manual methods in conducting qualitative data analysis. Although using both methods can offer many benefits, it is crucial to use the advantages of one method to address the drawbacks of the other where possible. While these benefits should be observed when combining both methods, the challenges of both methods must be acknowledged. Conclusion: This study emphasises the complementary advantages of digital and manual qualitative data analysis methods. Recommendation: A well-rounded strategy that uses the benefits of both approaches is advised to provide thorough and complex qualitative research results.
- Qualitative data analysis
- Digital software
- Manual methods
- Quasi-experimental research
WeChat QR code

- Open access
- Published: 31 August 2024
Experiences managing behavioral symptoms among Latino caregivers of Latino older adults with dementia and memory problems: a qualitative study
- Michelle S. Keller 1 , 2 , 3 ,
- Nathalie Guevara 4 ,
- Jose-Armando Guerrero 5 ,
- Allison M. Mays 4 ,
- Sara G. McCleskey 6 ,
- Carmen E. Reyes 3 &
- Catherine A. Sarkisian 3 , 7
BMC Geriatrics volume 24 , Article number: 725 ( 2024 ) Cite this article
3 Altmetric
Metrics details
Latinos are more likely than non-Latino Whites to develop dementia and be prescribed antipsychotics for dementia-related behavioral symptoms. Antipsychotics have significant risks yet are often overprescribed. Our understanding of how Latino caregivers of Latino older adults living with dementia perceive and address behavioral issues is limited, impeding our ability to address the root causes of antipsychotic overprescribing.
We interviewed Latino older adults’ caregivers and community-based organization workers serving older adults with cognitive impairment (key informants), focusing on the management of behavioral symptoms and experiences with health services.
We interviewed 8 caregivers and 2 key informants. Caregivers were the spouses, children, or grandchildren of the older adult living with cognitive impairment; their ages ranged from 30 to 95. We identified three categories of how caregivers learned about, managed, and coped with behavioral symptoms: caregivers often faced shortcomings with dementia care in the medical system, receiving limited guidance and support; caregivers found community organizations and senior day centers to be lifelines, as they received relevant, timely advice and support, caregivers often devised their own creative strategies to manage behavioral symptoms.
In-depth interviews suggest that the healthcare system is failing to provide support for behavioral symptoms from dementia; caregivers of Latino older adults rely on community organizations instead.
Peer Review reports
Introduction
The Latino population aged 65 years or older is projected to quintuple over the next four decades, rising to 22% of the older population in the U.S. by 2060 [ 1 ]. One of the critical issues facing Latino older adults is Alzheimer’s Disease and Related Dementias. Dementia describes a group of symptoms affecting cognitive function, memory, language, problem-solving, and social abilities [ 2 ]. Older adults with dementia can exhibit behavioral symptoms such as agitation, aggression, confusion, sleep disturbance, delirium, and walking about, which can be challenging for caregivers to experience and manage [ 3 ]. Many of these behavioral symptoms may be in response to unmet needs, such as hunger, thirst, pain, or lack of physical or social activity [ 4 ]. An estimated 1.3 million Latino older adults are expected to have dementia by 2050 [ 5 ]. Latino older adults are more likely to develop dementia than non-Latino White older adults [ 5 ]. Hypothesized risk factors driving this increased risk of dementia among Latinos include higher rates of type 2 diabetes, depression, hypertension, and cardiovascular disease [ 6 ] and lower levels of educational attainment [ 7 , 8 , 9 ]. Additionally, Latino older adults have earlier onset of dementia symptoms [ 10 ] and a higher prevalence of dementia-related behaviors such as hallucinations, combativeness, or wandering, compared to non-Latino White older adults [ 11 ].
Antipsychotics are psychotropic medications that are sometimes prescribed off-label to manage dementia-related behavioral symptoms such as agitation and aggression, however, these medications have limited positive effects and can increase cognitive decline, risk of falls, stroke, and death [ 12 , 13 ]. The American Geriatrics Society strongly recommends that older adults with dementia avoid these medications unless non-pharmacological interventions have failed and the older adult is posing a threat to themselves or others [ 14 ]. Choosing Wisely, an initiative of the ABIM Foundation which promotes conversations between clinicians, patients, and caregivers about making choices to optimize high-quality care, notes that antipsychotics for dementia are regarded as low value care, i.e., care that is potentially unnecessary or harmful to patients [ 12 , 15 ]. Low value care is described as medical services that should generally be avoided in favor of high value care, i.e., interventions, medications, or services which offer greater benefits compared to their risks. In the case of dementia, high value interventions and medications for addressing behavioral symptoms include non-pharmacological interventions such as reassuring disoriented individuals, reducing noise levels, providing stimulation with structured activities (e.g., music, crafts), addressing underlying pain or hunger, and providing physical activity throughout the day [ 16 ]. Second-line interventions include some classes of antidepressants, which have a safer risk profile for older adults.
Despite guidelines recommending against the use of antipsychotics in older adults with dementia, research shows they are frequently used in community dwelling older adults with dementia: more than one in five (21.6%) of older adults with dementia in the U.S. had at least one antipsychotic fill within the year [ 17 ]. Moreover, use of these medications is higher in Latino older adults compared to non-Latino Whites [ 18 ]. Latino older adults have a 1.62-fold greater use of antipsychotics compared to non-Latino White older adults [ 18 ]. Yet it is not understood why Latino older adults with dementia are more likely to receive antipsychotics than their non-Latino counterparts. Possible reasons for this disparity include low levels of dementia knowledge among Latino family members caring for older adults, low access to high-quality dementia care, or low levels of health literacy – defined as the ability to find, understand, and use information and services to inform health-related decisions [ 18 , 19 ].
Informed and engaged caregivers can act as advocates for reducing low-value care – including antipsychotics – in persons with dementia. Yet we have limited understanding of how Latino caregivers perceive and understand various strategies to address behavioral issues in dementia. This gap in knowledge is a barrier to designing and implementing interventions aimed at addressing the overuse of low value care among Latinos older adults with dementia. The objective of this study was to explore the knowledge and experiences Latino caregivers of Latino older adults with dementia have around managing the behavioral symptoms of dementia as well as their experiences discussing medications for these symptoms with clinicians using a qualitative approach. Additionally, we sought to understand how Latino caregivers of Latino older adults with dementia managed their family member’s medications, and the types of conversations they had with medical providers around medication use. We also aimed to explore caregivers’ experiences with dementia-related health services to identify potential gaps in care. Understanding why Latino older adults are more likely to be prescribed antipsychotics for dementia-related behavioral symptoms can provide important background for designing interventions to reduce the use of these medications when possible.
Subjects and methods
Study design.
We used a qualitative study design with semi-structured interviews conducted individually with Latino caregivers caring for Latino older adults as well as key informant interviews with caregiver advocates. Interviews were conducted in English and Spanish according to participant preference. Caregiver advocates included dementia support group leaders and senior day care center staff. We offered phone interviews to ensure that individuals with varying levels of digital literacy could participate. Additionally, as caregivers often have a difficult time finding respite care, phone interviews allowed caregivers to participate without leaving the home. Moreover, this study took place during the Covid-19 pandemic, which limited our ability to safely conduct interviews in person. We conducted interviews from October 2020-March 2021. We worked closely with a Community Advisory Board (the Los Angeles Community-Academic Partnership for Research in Aging, or LA CAPRA) as part of the UCLA Resource Centers for Minority Aging Research Center for Health Improvement of Minority Elderly (RCMAR/CHIME). We worked with the Community Advisory Board members to define the eligibility criteria, develop recruitment strategies, and design the interview guide. LA CAPRA includes leaders from community-based health organizations, community representatives, community development groups, and senior services organizations. The study was reviewed and approved by the Cedars-Sinai Medical Center Institutional Review Board.
Study participants
Eligibility criteria for caregivers included: serving as a caregiver for a Latino family member either diagnosed with dementia or experiencing memory problems, being 18 years of age or older, and identifying as Latino. Per a recommendation from Community Advisory Board members, we interpreted the definition of the caregiver role broadly because it was felt that Latino families frequently share caregiving responsibilities among several family members.
We opted to interview key informants – caregiver advocates – as well as Latino caregivers in an effort to gain perspective of individuals who regularly interact with caregivers and learn about many challenges and experiences related to caregiving. Eligibility criteria for caregiver advocate key informants, who did not have to be Latino, included having regular contact with Latino caregivers of persons living with dementia in a professional context (e.g., serving as a caregiver support group leader or staff member at a senior day care center serving older adults with dementia).
Recruitment
To recruit caregivers, we used several methods, including (1) flyers posted in geriatrics and primary care clinics at Cedars-Sinai Medical Center, a large health system in Los Angeles, CA with numerous outpatient clinics; (2) direct referrals from geriatricians and primary care physicians at Cedars-Sinai Medical Center; (3) flyers distributed through senior day care centers; (4) word of mouth (i.e., snowball sampling); and (5) emails and phone calls to caregivers participating in support groups associated with Los Angeles-area senior day care centers. We used a brief screening phone call or email to confirm eligibility and then scheduled the interview.
To recruit caregiver advocates, we relied on community partners in the Community Advisory Group to identify caregiver support group leaders and senior day care center staff in the Los Angeles area and emailed potentially eligible study participants. Study participants (caregivers and key informants) were offered a $60 gift card for their participation. We provided information sheets prior to the interviews via email and obtained oral informed consent from all study participants for this study.
Interview guide
Our interview guide (Table 1 , Appendix 1 ) for caregivers included a variety of topics structured around managing behavioral symptoms and experiences with healthcare services. We translated the interview guide into Spanish for the Spanish-language interviews using a professional translation service. MSK and NG, both fluent Spanish speakers, conducted the interviews in Spanish. For caregivers, we collected demographic information, including age, gender, race, ethnic background, educational level, and employment. We also collected demographic information about the person living with dementia and their caregivers. For caregiver advocates, we collected data on age, gender, race, ethnicity, and employment information. Interviews lasted 60–120 min and all were conducted by phone.
Data analysis
All participants were asked for permission to audio-record the interviews. We audio-recorded the interviews and sent them out for professional transcription (and translation, if the interviews were in Spanish). Our study methodology was guided by Constructivist Grounded Theory (CGT) ([ 20 , 21 ]. CGT is characterized by its inductive approach, where codes are constructed from the data and there is simultaneous data collection and analysis. After each interview, we refined the interview guide to explore potential lines of inquiry.
Two coders (NG and JAG) used line-by-line open coding to code all of the interviews in Dedoose, a qualitative coding software (Dedoose Version 9.0.17, (2021). Los Angeles, CA: SocioCultural Research Consultants, LLC) [ 22 ]. Line-by-line coding applies a code to every line of the data, allowing researchers to stay close (i.e., grounded) to the data [ 20 ]. Three investigators (MSK, NG, and JAG) met weekly for 10 weeks to discuss initial codes. All three members of the coding team were involved in discussions to create and refine the codes. Disagreements about the codes were resolved by reviewing the transcripts together in areas of disagreement and coming to a consensus both about how the code should be described and to which types of texts it should be applied. We used process coding [ 23 ], a method of coding which uses gerunds to describe actions in the data. For example, a line of text where a caregiver describes feeling frustrated with the jargon being used by medical professionals might be coded Feeling frustrated with physician about complex language. Process coding, used in conjunction with line-by-line coding, allows qualitative researchers to closely identify participants’ actions, beliefs, and experiences, reducing potential bias imposed by researchers [ 20 ].
After all transcripts were coded through this initial coding process, we exported all of the codes from Dedoose to an Excel spreadsheet and manually grouped the codes into focused, or second-level, codes, which are more conceptual in nature [ 20 ]. To maintain rigor, we discussed the creation of each focused code among the team. We then created the focused codes in Dedoose and categorized the initial codes under each focused code using the software. Finally, we grouped the focused codes into categories, discussing the nuances and complexities – referred to as properties in CGT – within each category.
In CGT, there is a focus on constant comparison throughout the analytic process [ 24 , 25 ]. For example, we compared caregivers’ experiences with discussing behavioral symptoms with clinicians, developing strategies to manage behavioral symptoms, and sharing caregiving responsibilities with other family members. We met weekly throughout the analysis process to construct categories from the codes, noting down potential categories in written memos. Memo writing was used to record decision-making about initial code, focused code, and category construction; articulate potential nuances in each category; and communicate analytic decisions within the team [ 26 ]. Memo writing also allowed us to create an audit trail of our analytic process.
We interviewed eight caregivers and two key informants. Caregivers were the spouses ( n = 2), children ( n = 4), or grandchildren ( n = 2) of the person living with dementia or experiencing memory problems, and caregivers’ ages ranged from 34 to 95 (Table 2 ). Our sample included two mother-daughter pairs caring for the spouse/father in the family where we interviewed both the daughter and the mother. Caregivers in our study identified as Peruvian, Salvadorian, Chicano, Mexican, and Venezuelan, and all resided in California (all but one resided in Southern California). Nearly all had some college education.
Our key informants included a social worker (female, age: 50, non-Latina White) embedded in a community organization that provides adult day care services, and an activities coordinator at an adult day care center serving predominantly Latino older adults (female, age: 56, Mexican-American).
We identified three main categories of how caregivers learned about, managed, and coped with dementia and/or memory-related behavioral symptoms from our interviews: (1) caregivers often faced shortcomings with dementia care in the medical system, receiving limited guidance and support; (2) caregivers found community organizations and senior day centers to be lifelines in helping to manage symptoms, (3) caregivers often devised their own creative strategies to manage and minimize behavioral symptoms. Within each category, we identified sub-categories and describe them below. We use pseudonyms for the study participants in this manuscript to protect participant confidentiality.
Facing shortcomings with dementia care in the medical system
Struggling with getting the diagnosis confirmed.
Several caregivers described having a difficult time receiving a dementia diagnosis for their family member. Diego, 41, described that it took six months to get an initial evaluation with a neurologist to receive a diagnosis for his grandmother, making it difficult for him to get the appropriate services his grandmother needed. Clara, 34, also caring for her grandmother, reported laboring to find a doctor who believed her grandmother’s symptoms weren’t just old age. She described going to a primary care doctor to discuss her grandmother’s worsening symptoms, which included aggression and hiding things, and the doctor told her, Oh , don’t worry , she just old.
Two caregivers in our sample, 34-year-old Soledad and 57-year-old Maria, a mother and daughter pair, had several family members working in the medical system in both the U.S. and Mexico. In addition, Soledad and Maria regularly connected with family in Mexico to learn about the medications Soledad’s father/Maria’s husband was taking. This background empowered Soledad and her family to become more actively engaged in her father’s care. Despite this background, Soledad also struggled with getting specialty dementia care for their father. Soledad worried that her father had not yet seen a neurologist and explained that there were barriers that made it particularly difficult for her and her siblings to advocate for their father. First, she noted that her mother, Maria, who served as the primary caregiver for her father, did not speak English well so sometimes had a difficult time serving as an advocate. Second, she noted that she was located in Southern California while her parents were several hours away, and helped as much as she could, but she was not always able to accompany her father to the doctor’s appointments.
Interviewer: What is the process of diagnosis, what’s that has been like for [your father]? Soledad: It’s been a little rough because we definitely have been trying to get him better care. I know we’re trying to get him into a neurologist so that way they can do more activities, and I’m not sure if he’s seen like a therapist, psychologist… But I know it’s hard because we’re not 100% there to deal with the doctors directly…. But we’ve been trying to get him some extra help to see– so that way they can determine the actual condition. He’s with [health system] in [Central California] so it’s been a little tough trying to get things situated for him, because I don’t want it to get too far out because my dad’s dad had Alzheimer’s… We don’t want it to get to that severity where, you know, he doesn’t know where he’s at and he can get lost. We don’t want it to get to that level.
One of the key informants, Dina, a social worker at a senior day care center, confirmed the caregivers’ experiences, noting that many caregivers she met in support groups had family members who haven’t specifically been diagnosed with Alzheimer’s disease. A lot of doctors are , you know , resistant to doing that.
Dina: A lot of people come in and they’ve been seeing their primary care physician, and that could be someone they’ve been seen for 10, 15, 20, 30 years. And they trust them, but they’re not dementia savvy. And so a lot of them will say, Oh, this is just normal aging, or, Oh, they’re getting a little forgetful. And it takes them, the family members coming to the support group sometimes and sharing what’s going on, and the other members, as well as me telling them, You really need to ask for a referral to see a neurologist, to get some more, there’s some more going on than just, you know, normal age-related memory loss.
Julia, our second key informant, also described how clinicians working in smaller clinics or practices outside of large health systems weren’t as knowledgeable about dementia, making it difficult for family members to obtain a diagnosis. She described how the Latino caregivers she encountered often got little information about what to expect regarding the stages of dementia.
Julia: … the doctors in big hospitals, they know more or less how to find out that the patient is coming up with Alzheimer’s because they have more experience and, and they’ve been around more people. But, you know, the doctors in the small clinics, they don’t know much about Alzheimer’s.
She described how even when she advised Latino caregivers to advocate for their family members in these smaller practices, the clinicians were uncomfortable or upset about being questioned, particularly around the diagnosis of dementia or about prescribing medications such as cholinesterase inhibitors, thought to slow the progression of some dementia-related symptoms. She described how some doctors serving Latinos were not used to empowered patients or caregivers who asked a lot of questions:
Julia: And sometimes when the family knows… and I tell ‘em, You know what? She’s becoming very forgetful. Talk to the doctor and see if she can get some medication. Sometimes they even say that the doctors start laughing at that them. “Oh, so now you’re the doctor? So now you know what to prescribe to your mom or to your dad?”
Several caregivers said that they were concerned they did not have information about the progression of dementia and did not know what to expect. Clara described how she was worried her grandmother’s geriatrician may have been wary of preparing her for difficult days ahead, which she understood, but wished she understood what to expect:
Interviewer: Have you had conversations about either your grandma’s current behavior or what to expect with [the geriatrician] or anybody else? Clara: No. [the geriatrician] just said that, you know, yes, she has dementia, but since my grandma really enjoyed, doing puzzles and being outside that she doesn’t think my grandmother will become that bad. She thinks that, you know, the forgetting things that’s, mixing up her days, the way she does, she said that that, that, that’s gonna be normal. But because my grandmother likes to do things a lot that perhaps we might not be there. But she might be sugarcoating it, I don’t know, not to freak us out, you know?
Receiving medications for behavioral symptoms from clinicians, but little guidance on non-pharmacological therapies
Discussions with clinicians around behavioral and psychiatric symptoms were primarily centered on medication management. Several caregivers noted that their clinicians recommended medications for behavioral symptoms, including anti-depressants, benzodiazepines, and antipsychotics but offered few resources outside of medications. Maria explained that she had recently begun taking benzodiazepines prescribed to her by her doctor for anxiety and that she had given her husband a few pills to calm down his anxiety. When she found that they calmed him down, she talked to his doctor, who then gave him his own prescription, but soon had to add another medication to help with his anxiety:
Maria: I gave him one of my pills and I saw that he calmed down a bit and it helped him. And I made an appointment with his doctor and I told him and he said, Okay, let’s try them. He prescribed them to him and I have been giving them to him. But last year, even those weren’t working. So, that’s when I told all of these things to the doctor. I told her about his entire situation with memory and the stories that he would tell me over and over again… So, all of these things worried me and I told the doctor about them. So, I told her that the pills were not working anymore. So, she gave me some pills to help with his anxiety. So, I asked if I should take him off the other pills and she said, No, give him both. And then she prescribed some sleeping pills. So, that’s how we’re doing with that situation. But there are times when not even those pills work because he feels desperate, anxious, and restless.
Diego had a similar experience, where a physician prescribed quetiapine, an antipsychotic, for his grandmother’s sleeping issues and aggression but did not provide him with additional information on how to manage his grandmother’s behavioral symptoms. He found the process of managing his grandmother’s healthcare overwhelming and noted that it was difficult to absorb the information from his grandmother’s doctors. Likewise, Soledad described that she had received little guidance from her father’s physicians on how to manage her father’s anxiety and confusion and instead she and her family relied on their own approach for managing his symptoms.
Interviewer: Have any doctors or friends or family recommended any particular strategies that help when he gets like, with the questions, for example? Soledad: Not really. No, hmmm, let’s see… Yeah, no. We just pretty much treat him as a kid, I mean, that’s we just have to pretty much think like you’re teaching a young child. In many occasions, we have to put our mindset that he’s at that level where we have to be extra careful and cautious of how we say things and just mild with a lot of things that we say to him.
Adriana, 52, who at the time of the interview was caring for her mother, described how her mother often got confused, for example, forgetting when she had already taken her medicine. Although she described that her mother’s physician was very attentive to caring for a variety of conditions, Adriana noted that she had not received any education on how to manage her mother’s confusion or other dementia-related behavioral symptoms.
Caregiver advocates confirmed these experiences. Dina, the social worker, described that in her experience, clinicians had little training or knowledge about how to help caregivers with behavioral symptoms and focused primarily on managing these symptoms with medications.
Dina: I think very, very few of them give alternative means of talk about managing behaviors. Usually they say send them to an adult daycare facility or place them. Um, a lot of doctors will say, well, if you can’t manage it, you know, maybe you should just pay for care or get a care, you know, get a caregiver in the home, that kind of thing. They don’t really go into educating the caregiver on how to manage behaviors. So, with the medication, they’ll talk to them about what the medication will do.
Julia, the activities coordinator at the adult day care center, noted that she spent a lot of time guiding family members about how to manage behavioral symptoms of dementia because she felt these were often unaddressed in the medical setting. She described coaching family members on how to manage wandering, hallucinations, and aggression, using strategies such as going with the flow, while avoiding arguing or telling the person living with dementia that they are going crazy.
Receiving little information about community-based resources from clinicians
Caregivers also mentioned that they often received few resources for caregiver support or training, for example information about feeding persons with advanced dementia. When asked whether the health system or physicians in the U.S. had given them resources on dementia care, Soledad explained:
Not really. We have doctors that have been suggested to us in Mexico, because my grandma currently has dementia. My mother’s mom has currently dementia and then my dad’s dad had Alzheimer’s, so we do have the resources to go to doctors in Mexico. My parents do travel two times a year, and they stay out there for a couple months. Other than that, no.
When resources were provided, Roberto, 30, who was caring for his mother, noted that it was a general sheet of resources and did not offer culturally or linguistically tailored community organizations or information. Roberto described how he had found an organization that provided culturally tailored caregiver support and had found it to be very helpful in providing him with education on how to manage the symptoms of dementia, but that he had had to find it on his own.
Interviewer: How did you get connected with the [organization] caregiver program? Roberto: I searched for a caregiver support group or I looked for a caregiving or maybe an adult day care center or similar, social service center that was Latino or something and I think that’s how I found the [organization] caregiver group…. Interviewer: And so some of the physicians that your mom sees, had they ever mentioned the existence of these kinds of groups before? Roberto: No.
Paulina, 65, noted that in her experience, physicians in the dementia specialty center where her father was receiving care spent a lot more time measuring her father’s dementia progression and little time explaining how to actually manage the behavioral symptoms associated with dementia. She expressed her frustration with their focus on the assessments rather than more tailored information about resources that would be helpful for her father:
Paulina: The most that my dad’s doctor did was give them a list of resources. That’s the most that she did. The Alzheimer program is much the same way. I mean, the assessment was, oh my God this oh, incredibly long, Count backwards from 98 to one. I’m going to give you five words and in a few minutes I’m going to ask you to remember them. I mean, it’s pretty useless doing that every time and realizing that of course the person is getting worse. Of course the person is going downhill. A list of resources is … We had already found out about the daycare long before because I think the [city] prides itself in giving opportunities for everyone.
Finding guidance through community organizations
Role of community-based resources in supporting latino caregivers with dementia-related behaviors.
Caregivers turned to other trusted sources of information for resources, including non-profit senior community centers and adult day care centers. For instance, Clara noted that she appreciated the emails and letters from the adult day care center her grandmother attended, which provided information and resources about dementia. The adult day care center staff also called her with updates about her grandmother and how to manage new symptoms.
Clara: [The senior day care center] does a really good job of sending out emails and little letters in case someone needs support. And thankfully, I haven’t had the need to or or felt like I really, really needed support. I’ve been doing pretty well with her. But I do feel like if there was that case, I could always talk to them, and the best part about it is that they’ve given me their cell phone numbers. So, you know, I can even call them and just say, Hey, you know, she did this, you know?
Paulina and Diego both noted that the senior community center their family member attended became a lifeline. Paulina described that the community center provided both culturally competent subsidized care for her father and a resource for her and her mother in terms of helping them cope with dementia.
Paulina: It became very clear to us that [the senior community organization] was the most important thing in his life…. [the Latino caregiver services staff member] would tell me too, Oh, your dad was especially confused today. Just wanted to let you know. Your dad did this today. He didn’t want to play dominoes with us. He didn’t even want me to help him. They knew of his gradual decline as well, because they would see him. The [center director] is always available to me. [The center director] always knew that she could call me. And then [the Latino caregiver services staff member] gave me her cell phone number.
Dina, the social worker, described how some physicians who were knowledgeable about community-based resources were able to refer family members struggling with behavioral issues to support groups, where they often received guidance both from support group staff and from people who were caring for persons living with advanced dementia.
Dina: And so a lot of reasons why they come into caregiver support group, is– I would say the majority of people came because either their physician – good physicians, right -- or their family members, like their adult children or friends or siblings, or, you know, family members have strongly suggested they go to care group a support group because they are seeing that they’re not handling the behaviors very well. And so they’re seeing that they’re getting frustrated and not accepting the reality of where their loved one is at, and really trying to kind of, um, push them.
Using creative strategies to manage and minimize behavioral symptoms, but struggling with how to manage trauma-related symptoms
Caregivers in our sample described that in the absence of much guidance from the healthcare system, they experimented with many different types of activities in order to reduce anxiety, depression, and agitation in their family member. Caregivers also reported how difficult experiences and trauma in their family members’ lives made them anxious or depressed, which was challenging for caregivers.
Creating activities and strategies independently to manage behavioral symptoms of dementia
Caregivers reported myriad behavioral symptoms in their family member with dementia, including disorientation, aggression, hallucinations, agitation, problems with sleep, confusion, and memory loss. Caregivers noted that they independently devised and tried a variety of creative ideas to reduce agitation and improve mental engagement, such as playing their family member’s favorite music, serving their family member their favorite foods from their home country, initiating games of dominoes or bingo, offering coloring books and puzzles, offering children’s books, and connecting their family member to other relatives on the phone.
Maria: Oh, yes, I play music for him. I do that. And he does become more relaxed with music. One of his daughters bought a record player to play the records he likes there. He plays records there. Or I play music for him on my phone. He likes listening to the radio.
Nearly all caregivers noted that they used strategies often used with children, such as using simple language when explaining things and using time outs when the person with dementia was feeling agitated or upset.
Clara: She is an adult, but I also feel that her brain is becoming back like a child. So, sometimes you need to put them on a timeout. So I tell her, You know what? I see that you’re very sad. I think… Or I see that you’re very upset, you know? Whatever the emotional issue is, I’ll tell her, Take some time out, go to your room and just relax, just relax. And when you’re ready to come back out, you know, then we can talk about it, you know, because it’s not good to, to talk about things when you’re emotional. You know, and then she’ll go to the room, and she’ll sit there, and I’ll tell her to do some coloring to get her mind off of it.
Finding it challenging to help family members with dementia address experiences of trauma earlier in life
Multiple caregivers spoke about their family member’s experiences with trauma earlier in life, often due to poverty or political strife, and how it affected their family member’s mental health. Caregivers found it challenging to help their family members manage symptoms related to anxiety and depression related to their family members’ traumatic experiences. Clara described how her grandmother in El Salvador witnessed traumatic events, such as seeing her husband and son killed in front of her eyes. She found it challenging to know how to respond when she found her grandmother crying at night due to these painful memories.
Clara: I have noticed that at times, at night, … sometimes I’ll see her cry at night. And, and I’ll say, Hey, what’s wrong, you know? And then she’ll say, Oh, I’m just thinking about how old my son would be or, or where we would be right now with my husband? And, you know, she never remarried. Um, and so I think that, that affects her.
Maria also noted that her husband spent a lot of time talking about his difficult childhood, making it challenging for her to soothe his anxiety and distress. She didn’t know how to respond to his sadness and anxiety around this trauma, which caused her much distress.
Maria: And since he had a lot of problems with his father during his childhood, he’s carrying all of those issues. He’s repeated that to me many times and he still repeats it a lot. There were beatings and also financial struggles. So, they went hungry. So, he tells me all of those things. And he tells me a lot about an uncle that helped him a lot and he passed a while back. I tell him, ‘That’s good. That means that your father was really this man, your uncle. It’s like he’s not really gone because he’s on your mind. That’s good, that you remember.’ So, he talks and talks and all of that.
In this exploratory qualitative study of eight Latino caregivers and two key informants who work closely with caregivers, we identified three main categories describing approaches to managing behavior related to dementia symptoms and interacting with the healthcare system: caregivers (1) often face shortcomings with dementia care in the medical system, encountering delays to diagnosis, barriers in accessing neurologists and other specialists, and clinicians who dismiss symptoms of dementia as old age or who bristle at being questioned; (2) find resources and support from community based organizations, but receive little information from healthcare providers about these organizations; and (3) independently formulate creative strategies to manage behavioral symptoms in the absence of guidance, but find it challenging to manage symptoms associated with trauma. Although caregivers in our sample had different backgrounds and experiences, we found several commonalities with regards to their experiences caring for a family member with dementia. We found that regardless of knowledge or prior exposure to dementia, all caregivers in our sample wanted better access to resources to help them as caregivers. Our findings are consistent with literature that Latino caregivers are eager to learn more about dementia care and are aware of the importance of increasing their level of knowledge about the conditions [ 27 , 28 , 29 , 30 ].
We found that caregivers overall felt unprepared for managing their family member’s dementia diagnosis, even among caregivers with high levels of health literacy. This echoes other studies findings that many families feel ill-equipped to manage such a complex progressive diagnosis [ 28 , 30 ]. Other research finds that even when family members are aware of symptoms and have some familiarity with dementia, they do not always feel adequately equipped with how to address challenging situations, such as changes in the patient’s sleep or increasing levels of anxiety [ 31 ]. Moreover, many behavioral symptoms of dementia may be related to an inability to express unmet needs, such as hunger, thirst, loneliness/social isolation, boredom, and lack of physical activity [ 4 ]. Pain is also commonly the underlying cause of behavioral symptoms associated with dementia, particularly among persons with more severe cognitive impairment [ 32 , 33 ]. Caregivers may not be aware of how to identify these unmet needs or how to respond to challenges surrounding eating and drinking in the later stages of dementia [ 34 ].
Complicating caregivers’ experiences with dementia care is the fact that many primary care clinicians are not comfortable or trained in how to diagnose or manage individuals with dementia [ 35 , 36 ]. Several caregivers in our sample had a difficult time obtaining a diagnosis and found that clinicians dismissed their family members’ symptoms as old age, findings which other qualitative studies of caregiving (not limited to Latinos) have confirmed as well [ 27 , 28 ]. Our findings echo a 2019 Alzheimer’s Disease International report which surveyed 70,000 respondents across 155 countries that found that 62% of healthcare practitioners worldwide still perceive that dementia is a normal part of aging, which results in significant barriers to the appropriate diagnosis, treatment and care for persons living with dementia and their caregivers [ 37 ]. Moreover, prior research finds that primary care providers report limited time to address the complex management of dementia or have little knowledge about the dementia diagnostic process [ 38 , 39 ], and that caregivers report receiving inadequate support from their providers in managing dementia-related problems [ 34 , 40 ]. Moreover, primary care providers report having little connection to social services, community organizations, or interdisciplinary teams which could assist caregivers with dementia management [ 38 , 41 ]. These factors can make for unsatisfactory encounters between persons with dementia, caregivers, and clinicians, and can result in caregivers feeling underprepared and dissatisfied with how the medical system manages dementia. Future research should examine how to design better care experiences for persons with dementia and their families within the current medical system.
Our findings shed light on some of the challenges faced by Latino caregivers as they look to clinicians for assistance on managing behavioral symptoms of dementia. When asked about conversations with clinicians to manage dementia-related behavioral symptoms, caregivers in our sample often brought up discussions with clinicians about the use of medications to treat sleeping problems, anxiety, depression, and agitation. One reason for prioritizing medications over non-pharmacological therapies may be the medical system’s approach to health as informed by a cure model, where a biomedical approach is prioritized over a psychosocial approach (i.e., the care model) [ 42 , 43 , 44 ]. Even as some primary care providers are aware of the limits of the biomedical approach when it comes to dementia care, research has found they feel frustrated with the fact that there is little that medicine can do to alter the progression of the disease [ 39 ]. As a result, one study found that primary care physicians still regularly prescribed medications for dementia – even when they found them to be lacking in effectiveness – because they wanted to help patients and their families in some way [ 39 ]. Clinicians may perceive that medications are some of the few tools they are able to offer families struggling with managing difficult behavior symptoms. Additionally, health insurance covers medications, but does not routinely cover caregiver support. Training clinicians in how to offer tangible strategies for managing behavioral symptoms may provide primary care providers with additional tools they can offer families. However, offering such support can be challenging during a 10 to 15-minute primary care visit. Connecting caregivers to community organizations may be able to fill in gaps which primary care providers are not currently able to support.
Indeed, we found that caregivers in our sample found a great deal of support through community-based organizations and also their own families and solutions. Several interventions have been developed specifically tailored for Latino older adults living with dementia and their caregivers, including radio-based support groups [ 45 ], bilingual educational websites [ 46 ], telephone-based support groups [ 47 ], promotora- based community engagement [ 48 ], and culturally and linguistically tailored programs [ 49 , 50 , 51 ]. However, as we found in our study, linking caregivers to these types of programs and resources remains a challenge, as many health system-based clinicians and social workers may not have knowledge or updated lists of culturally and linguistically appropriate services. One promising intervention is the Care Ecosystem Model, a model which connects family caregivers with care navigators [ 52 , 53 ]. This model has been found to improve the quality of life in persons with dementia and decrease caregiver depression and burden [ 52 ]. Tailoring and disseminating the model to communities which serve a large proportion of Latinos has the potential to provide to substantial support to many caregivers.
Despite little guidance from medical professionals, caregivers in our sample found creative ways to engage their family members in meaningful and pleasurable activities such as playing music, offering coloring books and puzzles, or caring for pets. These meaningful activities may play an important role that goes beyond enjoyment: Nyman and Szymczynska found that these activities can meet fundamental psychological needs [ 54 ]. For example, these activities may give individuals a sense of control, address the need to be creative, and strengthen relationships and social connectedness [ 54 , 55 ]. Engaging persons with dementia in meaningful activities can also be critical for caregivers. An ethnographic study using interviews and participant observation found that when caregivers discontinue activities meaningful to persons living with dementia, caregiver burden increases substantially [ 56 ]. However, caregivers can adapt or replace activities as the dementia progresses, if provided the right training and social support. Supporting caregivers in adapting activities to changing barriers, such as the development of vision and hearing loss, as reported by several caregivers in our sample, is critical to both the progression of cognitive decline and caregiver health. Epidemiological studies have found that untreated vision and hearing loss can increase the risk of cognitive decline and dementia and accelerate the progression among those already living with dementia [ 57 , 58 , 59 ]. This research points to an even greater need to support caregivers who are caring for older adults with vision and hearing loss as well as dementia and associated cognitive decline.
One striking finding was the high prevalence of trauma in early life among the Latinos living with dementia in our sample. Some studies have found an association between experiencing several adverse childhood experiences such as parental death, family violence, physical or psychological abuse and dementia [ 60 ], and others have found a bidirectional relationship between post-traumatic stress disorder (PTSD) and dementia, where PTSD may increase the risk of dementia and the onset of dementia can increase the risk of delayed PTSD [ 61 ]. Persons living with dementia may experience traumatic flashbacks [ 62 ], which can be alarming for the person living with dementia and their caregiver. Symptoms of PTSD may be confused for behavioral symptoms of dementia [ 63 ]. However, caregivers and clinical staff made aware of the person’s past and potential triggers for the PTSD can employ strategies to reduce stress and agitation among persons living with dementia who have experienced traumatic events. A study of nursing assistants’ experiences caring for older people with dementia who experienced Holocaust trauma found that understanding the person’s life story enabled adjustments in care and gave the nursing assistants greater empathy and patience in caring for the person with dementia [ 64 ]. Training caregivers in how to manage PTSD in family members with dementia who have experienced traumatic events may reduce the use of psychoactive medications and improve caregiver burden.
There are several limitations in our study. First, Latinos as a group are extremely heterogenous and Latino ethnicity encompasses individuals from numerous countries and backgrounds. Additionally, many of the issues we identified are likely not unique to Latinos. Moreover, U.S. Latinos’ experiences may be largely shaped by the areas where they are living. Our findings are thus more generalizable to Latinos living in the Southern California area, where the majority of our sample was from. We also had a small sample size. However, despite this small sample, we found similar experiences among caregivers in our sample, and these experiences have been echoed in other qualitative studies of Latino caregivers of Latino older adults living with dementia. Moreover, several studies have found that 10 interviews typically produce the majority of salient themes in interview-based analyses [ 65 , 66 , 67 ]. Future research should examine similar questions with a larger sample or with Latinos in different regions of the country.
In conclusion, in this exploratory study of Latino caregivers’ experiences managing behavioral symptoms of dementia, we found that caregivers struggled with their family members’ dementia-related behavioral symptoms, including aggression, anxiety, depression, and sleeping difficulties. Caregivers also reported that clinicians often offered medications for behavioral symptoms. Caregivers found a great deal of support in community-based organizations, including senior day care centers, caregiver support groups, and intergenerational community centers. In-depth interviews with this small sample suggest that the healthcare system is failing to provide care for behavioral symptoms from dementia so that caregivers of Latino older adults rely on community organizations instead.
Data availability
The datasets generated and/or analysed during the current study are not publicly available due to their identifiable nature but are available from the corresponding author on reasonable request.
Hummer RA, Hayward MD. Hispanic Older Adult Health & Longevity in the United States: current patterns & concerns for the future. Daedalus. 2015;144(2):20–30.
Article PubMed PubMed Central Google Scholar
Plassman BL, Langa KM, Fisher GG, Heeringa SG, Weir DR, Ofstedal MB, et al. Prevalence of dementia in the United States: the aging, demographics, and memory study. Neuroepidemiology. 2007;29(1–2):125–32.
Article PubMed PubMed Central CAS Google Scholar
Hersch EC, Falzgraf S. Management of the behavioral and psychological symptoms of dementia. Clin Interv Aging. 2007;2(4):611.
PubMed PubMed Central Google Scholar
Cohen-Mansfield J, Dakheel-Ali M, Marx MS, Thein K, Regier NG. Which unmet needs contribute to behavior problems in persons with advanced dementia? Psychiatry Res. 2015;228(1):59–64.
Aging NHC. 2017 Status of Hispanic Older Adults: Insights from the field – Caregivers Edition. Washington, D.C.; 2017 2017.
Haan MN, Mungas DM, Gonzalez HM, Ortiz TA, Acharya A, Jagust WJ. Prevalence of dementia in older latinos: the influence of type 2 diabetes Mellitus, Stroke and genetic factors. J Am Geriatr Soc. 2003;51(2):169–77.
Article PubMed Google Scholar
Hazzouri AZA, Haan MN, Neuhaus JM, Pletcher M, Peralta CA, López L et al. Cardiovascular Risk score, cognitive decline, and dementia in older Mexican americans: the role of sex and education. J Am Heart Association.2(2):e004978.
Rodriquez EJ, Livaudais-Toman J, Gregorich SE, Jackson JS, Nápoles AM, Pérez-Stable EJ. Relationships between allostatic load, unhealthy behaviors, and depressive disorder in U.S. adults, 2005–2012 NHANES. Prev Med. 2018;110:9–15.
Katon W, Pedersen HS, Ribe AR, Fenger-Grøn M, Davydow D, Waldorff FB, et al. Effect of Depression and Diabetes Mellitus on the risk for dementia: a National Population-based Cohort Study. JAMA Psychiatry. 2015;72(6):612–9.
Clark CM, DeCarli C, Mungas D, Chui HI, Higdon R, Nuñez J, et al. Earlier onset of Alzheimer Disease symptoms in latino individuals compared with anglo individuals. Arch Neurol. 2005;62(5):774–8.
Sink KM, Covinsky KE, Newcomer R, Yaffe K. Ethnic differences in the prevalence and pattern of dementia-related behaviors. J Am Geriatr Soc. 2004;52(8):1277–83.
American Geriatrics Society. Don’t use antipsychotics as the first choice to treat behavioral and psychological symptoms of dementia. Philadelphia, PA: ABIM Foundation. 2015 [ http://www.choosingwisely.org/clinician-lists/american-geriatrics-society-antipsychotics-for-dementia/
Banerjee S. The use of antipsychotic medication for people with dementia: Time for action. London, England; 2009 October 3, 2009.
By the American Geriatrics Society Beers Criteria ® Update Expert P. American Geriatrics Society. 2019 updated AGS Beers Criteria ® for potentially inappropriate medication use in older adults. J Am Geriatr Soc. 2019;67(4):674–94.
Article Google Scholar
ABIM Foundation. Choosing Wisely: Treating Disruptive Behavior in People with Dementia 2017 [ https://www.choosingwisely.org/patient-resources/antipsychotic-drugs-for-people-with-dementia/
Gitlin LN, Kales HC, Lyketsos CG. Nonpharmacologic management of behavioral symptoms in dementia. JAMA. 2012;308(19):2020–9.
Maust DT, Strominger J, Bynum JPW, Langa KM, Gerlach LB, Zivin K, et al. Prevalence of psychotropic and opioid prescription fills among Community-Dwelling older adults with dementia in the US. JAMA. 2020;324(7):706–8.
Xiong GL, Filshtein T, Beckett LA, Hinton L. Antipsychotic use in a Diverse Population with Dementia: a retrospective review of the National Alzheimer’s Coordinating Center Database. J Neuropsychiatry Clin Neurosci. 2015;27(4):326–32.
Centers for Disease Control and Prevention. What Is Health Literacy? 2021 [updated May 19, 2021. https://www.cdc.gov/healthliteracy/learn/index.html
Charmaz K. Constructing grounded theory: A practical guide through qualitative analysis. Second edition. Thousand Oaks, CA: Sage; 2014 2014.
Charmaz K. Constructing grounded theory: a practical guide through qualitative analysis. London: Sage; 2006. 2006//.
Google Scholar
Gibbs GR. Thematic coding and categorizing. Analyzing Qualitative data. 2007;703:38–56.
Saldana J. The Coding Manual for qualitative researchers. London, UK: Sage Publications, Inc.; 2009.
Corbin J, Strauss A. Basics of qualitative research: techniques and procedures for developing grounded theory. Sage; 2014.
Corbin J, Strauss AC. Basics of qualitative research: techniques and procedures for developing grounded theory. Thousand Oaks, CA: Sage Publications, Inc.; 2008. 2008//.
Book Google Scholar
Birks M, Chapman Y, Francis K. Memoing in qualitative research: probing data and processes. J Res Nurs. 2008;13(1):68–75.
Borrayo EA, Goldwaser G, Vacha-Haase T, Hepburn KW. An inquiry into latino caregivers’ experience caring for older adults with Alzheimer’s disease and related dementias. J Appl Gerontol. 2007;26(5):486–505.
Neary SR, Mahoney DF. Dementia caregiving: the experiences of Hispanic/Latino caregivers. J Transcult Nurs. 2005;16(2):163–70.
Gelman CR. La Lucha: the experiences of latino family caregivers of patients with Alzheimer’s disease. Clin Gerontologist. 2010;33(3):181–93.
Turner RM, Hinton L, Gallagher-Thompson D, Tzuang M, Tran C, Valle R. Using an Emic Lens to understand how latino families cope with dementia behavioral problems. Am J Alzheimer’s Disease Other Dementias ® . 2015;30(5):454–62.
Iribarren S, Stonbraker S, Suero-Tejeda N, Granja M, Luchsinger JA, Mittelman M, et al. Information, communication, and online tool needs of hispanic family caregivers of individuals with Alzheimer’s disease and related dementias. Inf Health Soc Care. 2019;44(2):115–34.
Achterberg WP, Pieper MJC, van Dalen-Kok AH, De Waal MWM, Husebo BS, Lautenbacher S et al. Pain management in patients with dementia. Clin Interv Aging. 2013:1471–82.
Hodgson N, Gitlin LN, Winter L, Hauck WW. Caregiver’s perceptions of the Relationship of Pain to behavioral and Psychiatric symptoms in Older Community-residing adults with dementia. Clin J Pain. 2014;30(5).
Barrado-Martín Y, Nair P, Anantapong K, Aker N, Moore KJ, Smith CH, et al. Family caregivers’ and professionals’ experiences of supporting people living with dementia’s nutrition and hydration needs towards the end of life. Health Soc Care Commun. 2022;30(1):307–18.
Valcour VG, Masaki KH, Curb JD, Blanchette PL. The detection of Dementia in the primary care setting. Arch Intern Med. 2000;160(19):2964–8.
Article PubMed CAS Google Scholar
Foley T, Boyle S, Jennings A, Smithson WH. We’re certainly not in our comfort zone: a qualitative study of GPs’ dementia-care educational needs. BMC Fam Pract. 2017;18(1):1–10.
Alzheimer’s Disease International. World Alzheimer Report 2019: attitudes to dementia London. England: Alzheimer’s Disease International (ADI); 2019.
Hinton L, Franz CE, Reddy G, Flores Y, Kravitz RL, Barker JC. Practice constraints, behavioral problems, and dementia care: primary care physicians’ perspectives. J Gen Intern Med. 2007;22(11):1487–92.
Apesoa-Varano EC, Barker JC, Hinton L. Curing and caring: the work of primary care physicians with dementia patients. Qual Health Res. 2011;21(11):1469–83.
Jennings LA, Reuben DB, Evertson LC, Serrano KS, Ercoli L, Grill J, et al. Unmet needs of caregivers of individuals referred to a Dementia Care Program. J Am Geriatr Soc. 2015;63(2):282–9.
Kadu MK, Stolee P. Facilitators and barriers of implementing the chronic care model in primary care: a systematic review. BMC Fam Pract. 2015;16(1):12.
Baumann AO, Deber RB, Silverman BE, Mallette CM. Who cares? Who cures? The ongoing debate in the provision of health care. J Adv Nurs. 1998;28(5):1040–5.
De Valck C, Bensing J, Bruynooghe R, Batenburg V. Cure-oriented versus care-oriented attitudes in medicine. Patient Educ Couns. 2001;45(2):119–26.
Choudhury D, Nortjé N. The hidden curriculum and integrating cure- and care-based approaches to Medicine. HEC Forum; 2020.
Reynoso-Vallejo H. Support group for latino caregivers of dementia elders: Cultural humility and cultural competence. Ageing Int. 2009;34(1):67–78.
Weitzman P, Neal L, Chen H, Levkoff SE. Designing a culturally attuned bilingual educational website for US latino dementia caregivers. Ageing Int. 2008;32(1):15–24.
Bank AL, Argüelles S, Rubert M, Eisdorfer C, Czaja SJ. The value of telephone support groups among ethnically diverse caregivers of persons with dementia. Gerontologist. 2006;46(1):134–8.
Askari N, Bilbrey AC, Garcia Ruiz I, Humber MB, Gallagher-Thompson D. Dementia awareness campaign in the latino community: a novel community engagement pilot training program with promotoras. Clin Gerontologist. 2018;41(3):200–8.
Aranda MP, Villa VM, Trejo L, Ramírez R, Ranney M. El Portal latino Alzheimer’s project: model program for latino caregivers of people with Alzheimer’s disease. Soc Work. 2003;48(2):259–71.
Llanque SM, Enriquez M. Interventions for hispanic caregivers of patients with dementia: a review of the literature. Am J Alzheimer’s Disease Other Dementias ® . 2012;27(1):23–32.
Perales J, Moore WT, Fernandez C, Chavez D, Ramirez M, Johnson D, et al. Feasibility of an Alzheimer’s disease knowledge intervention in the latino community. Ethn Health. 2020;25(5):747–58.
Possin KL, Merrilees JJ, Dulaney S, Bonasera SJ, Chiong W, Lee K, et al. Effect of collaborative dementia care via telephone and internet on quality of life, caregiver well-being, and health care use: the care ecosystem randomized clinical trial. JAMA Intern Med. 2019;179(12):1658–67.
Possin KL, Merrilees J, Bonasera SJ, Bernstein A, Chiong W, Lee K, et al. Development of an adaptive, personalized, and scalable dementia care program: early findings from the Care Ecosystem. PLoS Med. 2017;14(3):e1002260.
Nyman SR, Szymczynska P. Meaningful activities for improving the wellbeing of people with dementia: beyond mere pleasure to meeting fundamental psychological needs. Perspect Public Health. 2016;136(2):99–107.
Roland KP, Chappell NL. Meaningful activity for persons with dementia: family caregiver perspectives. Am J Alzheimer’s Disease Other Dementias ® . 2015;30(6):559–68.
Allison TA, Gubner JM, Oh A, Harrison KL, Pham K, Barnes DE et al. Meaningful activities and sources of meaning for Community-Dwelling people living with dementia. J Am Med Dir Assoc. 2021.
Varadaraj V, Munoz B, Deal JA, An Y, Albert MS, Resnick SM, et al. Association of Vision Impairment with Cognitive Decline across Multiple Domains in older adults. JAMA Netw Open. 2021;4(7):e2117416–e.
Lin FR, Metter EJ, O’Brien RJ, Resnick SM, Zonderman AB, Ferrucci L. Hearing loss and Incident Dementia. Arch Neurol. 2011;68(2):214–20.
Thomson RS, Auduong P, Miller AT, Gurgel RK. Hearing loss as a risk factor for dementia: a systematic review. Laryngoscope Invest Otolaryngol. 2017;2(2):69–79.
Tani Y, Fujiwara T, Kondo K. Association between adverse childhood experiences and dementia in older Japanese adults. JAMA Netw Open. 2020;3(2):e1920740–e.
Desmarais P, Weidman D, Wassef A, Bruneau M-A, Friedland J, Bajsarowicz P, et al. The interplay between post-traumatic stress disorder and dementia: a systematic review. Am J Geriatric Psychiatry. 2020;28(1):48–60.
Dallam DL, Mellman TA, Bhatnagar A, Nguyen S, Kurukumbi M. Trauma reenactments in aging veterans with dementia. J Am Geriatr Soc. 2011;59(4):766–8.
Martinez-Clavera C, James S, Bowditch E, Kuruvilla T. Delayed-onset post-traumatic stress disorder symptoms in dementia. Progress Neurol Psychiatry. 2017;21(3):26–31.
Craftman ÅG, Swall A, Båkman K, Grundberg Å, Hagelin CL. Caring for older people with dementia reliving past trauma. Nurs Ethics. 2019;27(2):621–33.
Guest G, Bunce A, Johnson L. How many interviews are enough? An experiment with data saturation and variability. Field Methods. 2006;18(1):59–82.
Namey E, Guest G, McKenna K, Chen M. Evaluating bang for the buck: a cost-effectiveness comparison between individual interviews and focus groups based on thematic saturation levels. Am J Evaluation. 2016;37(3):425–40.
Guest G, Namey E, Chen M. A simple method to assess and report thematic saturation in qualitative research. PLoS ONE. 2020;15(5):e0232076.
Download references
Acknowledgements
Not applicable.
This work was supported by the National Institute on Aging: U.S. Deprescribing Research Network 2R24AG064025, UCLA Resource Centers for Minority Aging Research IV/Center for Health Improvement of Minority Elderly IIl (RCMAR IV/CHIME IIl) P30AG021684, Midcareer Award in Patient-Oriented Research in Aging 1K24AG047899-06. It was also supported by the National Center for Advancing Translational Sciences: UCLA Clinical and Translational Science Institute (CTSI) ULT1TR001881.
Author information
Authors and affiliations.
USC Leonard Davis School of Gerontology, 3715 McClintock Avenue , Los Angeles, CA, 90089, USA
Michelle S. Keller
Department of Health Policy and Management, Fielding School of Public Health, University of California-Los Angeles, Los Angeles, CA, USA
Division of General Internal Medicine and Health Services Research, Department of Medicine, David Geffen School of Medicine at UCLA, Los Angeles, CA, USA
Michelle S. Keller, Carmen E. Reyes & Catherine A. Sarkisian
Section of Geriatric Medicine, Department of Medicine, Cedars-Sinai Medical Center, Los Angeles, CA, USA
Nathalie Guevara & Allison M. Mays
David Geffen School of Medicine at UCLA, Los Angeles, CA, USA
Jose-Armando Guerrero
RAND Corporation, Santa Monica, CA, USA
Sara G. McCleskey
Geriatric Research Education Clinical Center (GRECC), VA Greater Los Angeles Healthcare System, Los Angeles, CA, USA
Catherine A. Sarkisian
You can also search for this author in PubMed Google Scholar
Contributions
MSK conceived of the study, received funding for the study, led the data collection and analysis, and led the manuscript writing. NG, JAG, and SGM assisted with the data collection, analysis, and manuscript writing. AMM, CR, and CS assisted with the study design, analysis, manuscript writing and editing.
Corresponding author
Correspondence to Michelle S. Keller .
Ethics declarations
Ethics approval and consent to participate.
Informed oral consent was obtained from all participants. The study was reviewed and approved by the Cedars-Sinai Medical Center Institutional Review Board.
Consent for publication
Clinical trial number, competing interests.
The authors declare no competing interests.
Additional information
Publisher’s note.
Springer Nature remains neutral with regard to jurisdictional claims in published maps and institutional affiliations.
Electronic supplementary material
Below is the link to the electronic supplementary material.
Supplementary Material 1
Rights and permissions.
Open Access This article is licensed under a Creative Commons Attribution 4.0 International License, which permits use, sharing, adaptation, distribution and reproduction in any medium or format, as long as you give appropriate credit to the original author(s) and the source, provide a link to the Creative Commons licence, and indicate if changes were made. The images or other third party material in this article are included in the article’s Creative Commons licence, unless indicated otherwise in a credit line to the material. If material is not included in the article’s Creative Commons licence and your intended use is not permitted by statutory regulation or exceeds the permitted use, you will need to obtain permission directly from the copyright holder. To view a copy of this licence, visit http://creativecommons.org/licenses/by/4.0/ .
Reprints and permissions
About this article
Cite this article.
Keller, M.S., Guevara, N., Guerrero, JA. et al. Experiences managing behavioral symptoms among Latino caregivers of Latino older adults with dementia and memory problems: a qualitative study. BMC Geriatr 24 , 725 (2024). https://doi.org/10.1186/s12877-024-05323-4
Download citation
Received : 13 February 2024
Accepted : 22 August 2024
Published : 31 August 2024
DOI : https://doi.org/10.1186/s12877-024-05323-4
Share this article
Anyone you share the following link with will be able to read this content:
Sorry, a shareable link is not currently available for this article.
Provided by the Springer Nature SharedIt content-sharing initiative
- Antipsychotics
- Alzheimer’s disease
BMC Geriatrics
ISSN: 1471-2318
- General enquiries: [email protected]
IMAGES
VIDEO
COMMENTS
Step 1 - Initial coding. The first step of the coding process is to identify the essence of the text and code it accordingly. While there are various qualitative analysis software packages available, you can just as easily code textual data using Microsoft Word's "comments" feature.
We call this process coding. [1] Coding is the iterative process of assigning meaning to the data you have collected in order to both simplify and identify patterns. This chapter introduces you to the process of qualitative data analysis and the basic concept of coding, while the following chapter (chapter 19) will take you further into the ...
Qualitative data coding (analysis) is the process of systematically transforming qualitative data into meaningful outcomes that represent the data and answer the research question(s ; Adu, 2019a).
Coding is the process of labeling and organizing your qualitative data to identify different themes and the relationships between them. When coding customer feedback, you assign labels to words or phrases that represent important (and recurring) themes in each response. These labels can be words, phrases, or numbers; we recommend using words or ...
The primary goal of coding qualitative data is to change data into a consistent format in support of research and reporting. A code can be a phrase or a word that depicts an idea or recurring theme in the data. The code's label must be intuitive and encapsulate the essence of the researcher's observations or participants' responses.
Planning your coding strategy. Coding is a qualitative data analysis strategy in which some aspect of the data is assigned a descriptive label that allows the researcher to identify related content across the data. How you decide to code - or whether to code- your data should be driven by your methodology.
The process of coding qualitative data varies widely depending on the objective of your research. But in general, it involves a process of reading through your data, applying codes to excerpts, conducting various rounds of coding, grouping codes according to themes, and then making interpretations that lead to your ultimate research findings.
Introduction to Qualitative Research Coding Josué Meléndez Rodríguez, MA, MSW Qualitative Research Lead, D-Lab PhD Student, School of Social Welfare ... Make note of subgroups within the data or aspects of the data that are important to your research. What unit of analysis is important to answer your question (e.g., individual
Coding qualitative data. Qualitative coding is almost always a necessary part of the qualitative data analysis process. Coding provides a way to make the meaning of the data clear to you and to your research audience. What is a code? A code in the context of qualitative data analysis is a summary of a larger segment of text.
Simply put, coding is qualitative analysis. Coding is the analytical phase where researchers become immersed in their data, take the time to fully get to know it (Basit, 2003; Elliott, 2018), and allow its sense to be discerned.A code is "…a word or short phrase that symbolically assigns a summative, salient, essence-capturing, and/or evocative attribute for a portion of language-based or ...
Transparency is once again a central issue of debate across types of qualitative research. Ethnographers focus on whether to name people, places, or to share data (Contreras 2019; Guenther 2009; Jerolmack and Murphy 2017; Reyes 2018b) and whether our data actually match the claims we make (e.g., Jerolmack and Khan 2014).Work on how to conduct qualitative data analysis, on the other hand, walks ...
Welcome to the companion website for The Coding Manual for Qualitative Research, third edition, by Johnny Saldaña. This website offers a wealth of additional resources to support students and lecturers including: CAQDAS links giving guidance and links to a variety of qualitative data analysis software.. Code lists including data extracted from the author's study, "Lifelong Learning Impact ...
Here are some resources for demonstrations on other methods for coding qualitative data: Qualitative Data Analysis [PDF] When writing up the analysis, it is best to "identify" participants through a number, alphabetical letter, or pseudonym in the write-up (e.g. Participant #3 stated …).
Having pooled our ex perience in coding qualitative material and teaching students how to. code, in this paper we synthesize the extensive literature on coding in the form of a hands-on. review ...
Qualitative data coding is the process of assigning quantitative tags to the pieces of data. This is necessary for any type of large-scale analysis because you 1) need to have a consistent way to compare and contrast each piece of qualitative data, and 2) will be able to use tools like Excel and Google Sheets to manipulate quantitative data.
Abstract. This chapter provides an overview of selected qualitative data analytic strategies with a particular focus on codes and coding. Preparatory strategies for a qualitative research study and data management are first outlined. Six coding methods are then profiled using comparable interview data: process coding, in vivo coding ...
A short course that will teach you how to analyze qualitative data. This short course is adapted from a semester length graduate level course taught at MIT covering Qualitative Research Methods. The first half of the course is covered in 21A.819.1x, and covers an introduction to qualitative research and conducting interviews.
Qualitative data software tools. When it comes to qualitative research and doing qualitative data analysis, having the right tools can make all the difference. There are a plethora of qualitative data analysis software available to help make interpretation a lot easier -- using both deductive and inductive coding techniques.
The Importance of Qualitative Data Coding in Research. Qualitative Data Coding plays a pivotal role in transforming raw information into meaningful insights. By systematically organizing this type of data, researchers can identify patterns, themes, and core concepts that inform their analyses. This process enhances the overall quality and ...
May 17, 2024. Reviewed by. Olivia Guy-Evans, MSc. Coding is the process of analyzing qualitative data (usually text) by assigning labels (codes) to chunks of data that capture their essence or meaning. It allows you to condense, organize and interpret your data. A code is a word or brief phrase that captures the essence of why you think a ...
Coding by Qualitative Design. Several types of qualitative approaches/designs. Ethnography, Phenomenology, Grounded Theory, Narrative Research, Case Study, Qualitative Descriptive. We will go through an example "chunk" of data, and code it together as if it were a Grounded Theory study.
Step 2: Assign sentiments. To quantify qualitative data in this situation, apply a sentiment to each response. Start small and tag as either positive, negative, or neutral sentiments. At a fundamental level, people will either be happy, unhappy, or neutral about a feature or interaction with your brand.
Elevate your qualitative research with cutting-edge Qualitative Coding Software. MAXQDA is your go-to solution for qualitative coding, setting the standard as the top choice among Qualitative Coding Software. This powerful software is meticulously designed to accommodate a diverse array of data formats, including text, audio, and video, while offering an extensive toolkit tailored specifically ...
Qualitative research is a type of research that aims to gather and analyse non-numerical (descriptive) data in order to gain an understanding of individuals' social reality, including understanding their attitudes, beliefs, and motivation. This type of research typically involves in-depth interviews, focus groups, or observations in order to collect data that is rich in detail and context.
Conclusion: This study emphasises the complementary advantages of digital and manual qualitative data analysis methods. Recommendation: A well-rounded strategy that uses the benefits of both approaches is advised to provide thorough and complex qualitative research results. Keywords. Qualitative data analysis
Process coding, used in conjunction with line-by-line coding, allows qualitative researchers to closely identify participants' actions, beliefs, and experiences, reducing potential bias imposed by researchers . ... Francis K. Memoing in qualitative research: probing data and processes. J Res Nurs. 2008;13(1):68-75.