

Hypothesis on Tropical Cyclone Freddy in Mozambique
Tropical cyclones, also known as hurricanes or typhoons in different parts of the world, are among the most powerful and destructive meteorological events on Earth. Their formation and trajectory are influenced by a complex interplay of geographic and climatic factors. This study focuses on Tropical Cyclone Freddy, which recently wreaked havoc in Mozambique, a southeast African country known for its rich cultural heritage and diverse landscapes.
Tropical Cyclone Freddy provides a unique case study for grade 12 Geography students to explore. By examining various variables such as sea surface temperatures, atmospheric pressure, wind speed and direction, and geographical features of Mozambique, learners can generate and test hypotheses that could explain the cyclone’s characteristics and impacts.
Guide for Generating a Hypothesis on Tropical Cyclone Freddy in Mozambique
Step 1: Understand the Problem
The first step in any scientific inquiry is to understand the problem at hand. In this case, the problem is Tropical Cyclone Freddy in Mozambique. Research about tropical cyclones, their causes, and impacts. Understand the geographical and climatic conditions of Mozambique. Consider what you already know about the factors that contribute to the formation and the path of a tropical cyclone.
Step 2: Gather Preliminary Data
Find data about Tropical Cyclone Freddy. This could include its path, wind speed, rainfall, damage caused, etc. Also, try to find data about the conditions in Mozambique before, during, and after the cyclone. This could include data about temperature, humidity, atmospheric pressure, and oceanic conditions. Other relevant data might include the time of the year the cyclone occurred, the state of the El Niño/La Niña cycle, and Mozambique’s geographical features that might influence cyclone paths.
Step 3: Identify Variables
From your research and the data gathered, identify the variables that might be connected to the problem. Variables could be anything that could influence the cyclone’s formation, path, or impacts. Examples might include sea surface temperature, atmospheric pressure, humidity, wind speed and direction, Mozambique’s topography, and population density.
Step 4: Formulate Your Hypothesis
A hypothesis is a testable statement that predicts the relationship between variables. Based on your understanding of the problem and the data you’ve gathered, make an educated guess about what might have caused or influenced the cyclone’s formation, path, or impacts. Your hypothesis should clearly state what you think the relationship is between your identified variables.
For example: “If sea surface temperatures were above average in the Indian Ocean off the coast of Mozambique prior to Tropical Cyclone Freddy, then this may have contributed to the cyclone’s formation and intensity.”
Step 5: Test Your Hypothesis
Plan and conduct an investigation to test your hypothesis. This could involve more detailed data analysis, creating models, running simulations, or even conducting experiments if possible.
Step 6: Analyze Your Results and Draw Conclusions
Analyze the results of your investigation to see if they support your hypothesis. If the data supports your hypothesis, then it may be valid. If the data doesn’t support your hypothesis, then it may need to be revised or discarded.
Remember, in scientific inquiry, even a hypothesis that turns out to be incorrect is valuable because it contributes to our understanding of the world. The goal is not necessarily to prove your hypothesis right, but to understand more about the world.
Step 7: Communicate Your Findings
Lastly, communicate your findings in a clear, organized manner. This could be in the form of a report, presentation, or discussion. Include your initial hypothesis, the methods you used to test it, your results, and what those results mean in the context of your hypothesis.
This guide should help you formulate and test a hypothesis about Tropical Cyclone Freddy in Mozambique. Remember, the process of scientific inquiry is iterative and often requires multiple rounds of hypothesis generation, testing, and revision. Good luck!
Example of Hypothesis Related to Tropical Cyclone Freddy in Mozambique
Here are ten possible hypotheses related to Tropical Cyclone Freddy in Mozambique. Remember, these are educated guesses based on what we know about tropical cyclones and the geography and climate of Mozambique. They would each need to be tested using appropriate methods and data.
- Hypothesis on Sea Surface Temperature: Higher sea surface temperatures in the Indian Ocean off the coast of Mozambique contributed to the increased intensity of Tropical Cyclone Freddy.
- Hypothesis on Atmospheric Pressure: Lower atmospheric pressure in the region where Tropical Cyclone Freddy formed led to the cyclone’s rapid intensification.
- Hypothesis on Wind Patterns: The prevailing wind patterns at the time of Tropical Cyclone Freddy’s formation influenced its path, leading it to make landfall in Mozambique.
- Hypothesis on Humidity Levels: High humidity levels in the atmosphere over Mozambique contributed to the high rainfall amounts associated with Tropical Cyclone Freddy.
- Hypothesis on Topography: The flat coastal plains of Mozambique contributed to the extensive flooding caused by Tropical Cyclone Freddy.
- Hypothesis on El Niño/La Niña Cycle: The stage of the El Niño/La Niña cycle at the time of Tropical Cyclone Freddy’s formation influenced its intensity and path.
- Hypothesis on Land Use: Deforestation and land use changes in Mozambique have increased the country’s vulnerability to the impacts of tropical cyclones like Freddy.
- Hypothesis on Urbanization: Urbanized areas in Mozambique experienced more severe impacts from Tropical Cyclone Freddy due to factors like population density and infrastructure.
- Hypothesis on Climate Change: Climate change, as evidenced by rising sea surface temperatures and increased atmospheric moisture, is making tropical cyclones like Freddy more intense and more damaging when they make landfall in Mozambique.
- Hypothesis on Coastal Barrier Systems: Degradation of coastal barrier systems, such as mangrove forests and coral reefs, has increased Mozambique’s vulnerability to storm surges associated with tropical cyclones like Freddy.
Each of these hypotheses can be tested using a combination of historical data, climate models, geographical analysis, and potentially ground-based surveys or studies.
Need Help with your School Project?
Are you struggling with your Project? Well, we can help you in terms of answering the questions and learning the key objectives of the topics. Please upload the pdf document of the Project and we will ensure we help you with the answering guide so that you pass it with distinctions.
[quform id=”3″ name=”contacts”]
Looking for something specific?

- Latest Resources
- Quick Links
Tropical Cyclone Freddy – Geography Grade 12 Research Task

On this page, we have compiled a general guide for Grade 12 Geography Students who are doing their research on Tropical Cyclone Freddy.
In this educational article, we will delve into the complex dynamics of Tropical Cyclone Freddy , a powerful weather system that posed significant threats and caused substantial impacts across various regions, notably Madagascar, Mozambique, and Malawi. This task will explore the formation, path, and consequences of Freddy, offering insights into the broader subject of tropical cyclones.
Tropical Cyclone Freddy
Tropical Cyclone Freddy stands as a significant weather event in the 2023 cyclone season , illustrating the potent force and extensive impact tropical cyclones can have on regions. Initially developing in the Indian Ocean, Freddy quickly intensified, showcasing the rapid and formidable growth capability of such storms. It made its mark by impacting multiple countries, with notable effects on Madagascar , Mozambique , and Malawi .
In Madagascar , Freddy made landfall on 21 February , near Mananjary, bringing with it powerful winds of up to 130 km/h and gusts of 180 km/h , causing widespread damage, including a storm surge and significant structural damage to homes and infrastructure. The cyclone’s arrival compounded challenges in regions already vulnerable from previous cyclonic activities and ongoing recovery efforts, exacerbating flood risks in areas with saturated soils from Cyclone Cheneso.
The cyclone’s path then took it across the Mozambique Channel, where it made a second landfall in Mozambique on 11 March , particularly affecting the Zambezia Province. Despite weakening to a tropical depression, Freddy continued to unleash heavy rains and strong winds, leading to extensive flooding, displacement of thousands, and destruction of homes and infrastructure. The cumulative rainfall in some areas reached more than what is typically expected in a month, stressing the critical situation in regions already dealing with the aftermath of previous weather-related disasters.
Freddy ‘s impact extended to Malawi , where it has been associated with severe weather conditions, including intense rainfall leading to mudslides and floods, particularly in the southern region. The cyclone’s effects have been devastating, with significant loss of life, displacement of communities, and damage to property and livelihoods. The government’s declaration of a State of Disaster in affected districts underscores the severity of the situation.
The trajectory and effects of Tropical Cyclone Freddy underline the complex challenges posed by such natural disasters in the context of global warming , which is believed to influence the frequency and intensity of tropical cyclones. Freddy exemplifies the urgent need for robust disaster preparedness, response mechanisms, and long-term strategies to mitigate the impact of similar future events on vulnerable communities.
Map indicating the path of the tropical cyclone Freddy

Why do tropical cyclones such as Freddy develop in late summer?
Tropical cyclones like Freddy tend to develop in late summer due to the optimal conditions present during this time—warm sea temperatures and high humidity levels. These conditions are crucial for cyclone formation, providing the energy necessary for these systems to intensify.
What is the impact of coriolis force and latent heat on the development of tropical cyclone Freddy?
The development of Tropical Cyclone Freddy was significantly influenced by the Coriolis force and latent heat . The Coriolis force, resulting from the Earth’s rotation, imparts a spinning motion to the storm, while the release of latent heat during condensation provides the energy that fuels the cyclone’s intensification.
Discussing the stage of development of the tropical cyclone Freddy.
Tropical Cyclone Freddy exhibited rapid intensification as it moved across the Indian Ocean. It reached its peak intensity just before making landfall, characterized by sustained winds and heavy rainfall. Freddy’s development showcased the dynamic and powerful nature of tropical cyclones under conducive environmental conditions.
Why can category 1 tropical cyclones be more destructive (damaging) than category 5 tropical cyclones?
Category 1 tropical cyclones can be more destructive than their Category 5 counterparts under certain circumstances. Factors such as slow movement over populated areas, leading to prolonged wind and rain exposure, and the specific vulnerability of the impacted regions can amplify the damage caused by lower-category cyclones.
How did tropical cyclone Freddy impact the following?
Environment.
Tropical Cyclone Freddy caused widespread environmental destruction, including flooding and landslides. These impacts were exacerbated in Madagascar, where soils were already saturated from previous cyclones, leading to significant flood risks.
The economies of the affected regions suffered greatly due to Tropical Cyclone Freddy . Infrastructure damage, agricultural losses, and the disruption of commerce and tourism were notable economic consequences of the cyclone.
People/Communities
The human toll was significant, with fatalities, displacements, and extensive damage to homes and communities. In Madagascar, Mozambique, and Malawi, thousands were left homeless or displaced, highlighting the devastating impact of Freddy on local populations.
What precautions can be implemented/ or has been implemented to reduce the impact of the tropical cyclone.
The local government/government of the country.
Governments implemented early warning systems, evacuation plans, and post-disaster relief efforts. In anticipation of Freddy, preemptive evacuations and the suspension of schools and public transport were notable measures taken to mitigate the cyclone’s impact.
The local residents
Residents were advised to secure property, stock emergency supplies, and adhere to evacuation orders. Community awareness and preparedness initiatives were crucial in minimizing the cyclone’s human and material toll.
Evaluating the impact of Global Warming on the frequency (regularity) of tropical cyclones such as Freddy.
Global warming is believed to influence the frequency and intensity of tropical cyclones. Warmer sea temperatures can lead to more frequent and more potent cyclones, as seen with Tropical Cyclone Freddy . The increasing regularity and severity of such weather events highlight the urgent need for climate action.
The Path of Tropical Cyclone Freddy
Formation and initial intensification.
Tropical Cyclone Freddy formed in the Indian Ocean in early February 2023. Displaying rapid intensification, it became a major concern for meteorologists and disaster preparedness officials due to its trajectory towards populated landmasses. This phase of Freddy’s path was marked by the accumulation of immense energy, fueled by warm ocean waters and conducive atmospheric conditions.
First Landfall in Madagascar
On 21 February , Freddy made its initial landfall on the eastern coast of Madagascar , near Mananjary. By this time, Freddy had achieved significant strength, with sustained average winds of 130 km/h and gusts of up to 180 km/h . This initial landfall was particularly devastating due to the pre-existing conditions in the region; soils were already saturated from the recent Cyclone Cheneso, exacerbating the flood risk and leading to widespread environmental and infrastructural damage.
Movement Across the Mozambique Channel
After crossing Madagascar, Freddy continued its path across the Mozambique Channel. During this phase, it maintained considerable strength, posing an imminent threat to mainland Africa. The cyclone’s trajectory through the channel was closely monitored as it aimed for a second landfall on the continent.
Second Landfall in Mozambique
Tropical Cyclone Freddy made its second landfall in Mozambique on 11 March , particularly affecting the Zambezia Province. Despite weakening to a tropical depression by the time of landfall, Freddy continued to generate intense rainfall across the region. This resulted in severe flooding, displacement of communities, and extensive damage to property and infrastructure. The impact in Mozambique highlighted the cyclone’s enduring power and the challenges of managing cyclone-related disasters in vulnerable regions.
Impact Beyond Landfall
The influence of Tropical Cyclone Freddy extended beyond its landfall points, affecting regions in southern Malawi with heavy rains and strong winds. The widespread nature of Freddy’s impacts underlines the extensive reach of tropical cyclones, capable of affecting areas far from the initial landfall site through associated weather patterns and rainfall.
Conclusion/Summary
Tropical Cyclone Freddy serves as a stark reminder of the destructive potential of tropical cyclones and the importance of preparedness and mitigation strategies. Its journey through Madagascar, Mozambique, and Malawi underscores the challenges posed by such natural disasters in the era of global warming. Personal reflections on the impact of tropical cyclones reveal a blend of awe for nature’s power and a resolve for better resilience and adaptive measures in the face of future storms.
Looking for something specific?
Related posts, economic geography grade 12 questions and answers.
Economic Geography Grade 12 Questions and Answers: Economic Geography Grade 12 Questions and Answers Refer to FIGURE 3.1 showing models of urban structure. Choose...

What Are the 6 Effects of Desertification?
What Are the 6 Effects of Desertification? The six effects of desertification are: What Are the 6 Effects of Desertification? Desertification is a significant...

Easy Ways to Calculate Magnetic Declination
Easy Ways to Calculate Magnetic Declination: Magnetic declination, also known as magnetic variation, is the angle between magnetic north (the direction the north end...
Grade 12 Geography Research Project about informal sector memo pdf
Grade 12 Geography Research Project about informal sector memo pdf Welcome to Grade 12 Geography Research Project: The Informal Sector in Thohoyandou Example Discover...

Name the plate on either side of the plate boundary that runs along the west coast of South America
The name of the plate on either side of the plate boundary that runs along the west coast of South America The plate boundary...

What is the Highest Mountain in Gauteng
What is the Highest Mountain in Gauteng: The highest mountain in Gauteng is Magaliesberg. This mountain range stretches approximately 120 kilometers from Pretoria through...
Previous Story
How to Write an Obituary - Examples for Grade 12 & Grade 11
44 unique english oral speech topics for grade 12 students.
Early action saves lives, as Tropical Cyclone Freddy hits Mozambique
 plane flies over cyclone-battered Nosy Varika, in Madagascar.")
Facebook Twitter Print Email
Tropical cyclone Freddy, one of the longest-lasting systems in the southern hemisphere, slammed into Mozambique on Friday, as UN agencies helped residents with early action.
Accurate early warnings and early action on the ground helped limit loss of life over the course of the cyclone, UN officials said.
UN agencies delivered a host of supplies ahead of the approaching cyclone and are providing assistance to those in need. Currently, strong winds and high seas are threatening Mozambique with dangerous and exceptional rainfall levels.
Critical preparations
The UN Children’s Fund ( UNICEF ) has been helping residents to brace for the storms for days.
“UNICEF teams are fully focused on protecting the tens of thousands of children impacted by this tropical storm and the devastating flooding it is causing,” said Maria Luisa Fornara, the UNICEF representative in Mozambique.
World Meteorological Organization February 24, 2023
“The coming hours and days are the most critical , and UNICEF will continue to work around the clock to support those in need,” she said.
UNICEF teams had assessed immediate needs and mobilized the rapid distribution of such critical supplies as safe water and water purification supplies, medical supplies, tents, and hygiene kits.
Early Warnings for All
UN officials underlined the importance of the Organization’s ongoing Early Warnings for All campaign in preventing the loss of life.
The World Meteorological Organization ( WMO ) has been tracking developments over the past weeks, including when it affected Madagascar days ago.
“Accurate early warnings and early action on the ground helped limit loss of life in Madagascar , with initial reports of seven casualties,” WMO said.
Before the cyclone made landfall in Madagascar, UNICEF had pre-positioned school kits for about 30,000 children , and the World Food Programme ( WFP ) has provided more than 25,000 hot meals to displaced people , UN Spokesperson Stéphane Dujarric told reporters at UN Headquarters on Friday.
“Our colleagues estimate at least 79,000 people have been impacted and these numbers could rise as the assessments are ongoing,” he said.
Government sounds early ‘red alert’
The UN Office for the Coordination of Humanitarian Affairs ( OCHA ) said that the Mozambique Council of Ministers declared on Tuesday a red alert enabling expedited and simplified response operations .
However, the confluence of multiple threats is compounding a severe humanitarian situation in Mozambique, where two million people need humanitarian assistance and protection across the northern provinces of Cabo Delgado, Niassa and Nampula, OCHA said.

Rare cyclone
Cyclone Freddy is exceptional because of the long distance it has travelled and its longevity, developing on 6 February off the coast northwest of Australia and affected island nations, including Mauritius and La Réunion, during its long journey across the entire South Indian Ocean.
This rarely seen track was last recorded in 2000 , with tropical cyclones Leon-Eline and Hudah.
Mozambique is regularly hit by the impacts of tropical cyclones , and flooding often poses a greater risk than the winds, WMO said. In January 2021, Tropical cyclone Eloise caused widespread damage and flooding on a long swathe of coastline and impacted an area that is still recovering from cyclone Idai , which hit in March 2019.
WMO said that in both the cases of Eloise and Idai, flooding affected Mozambique and neighbouring countries Zimbabwe, Malawi and parts of South Africa, which may be the case with cyclone Freddy.
- early warning system
Search form
Mozambique: tropical cyclone freddy, floods and cholera - situation report no.4, attachments.

This report is produced by OCHA Mozambique in collaboration with humanitarian partners. It covers the period 29 April until the 16 May 2023.
Over one million people have been affected by Tropical Cyclone Freddy, floods, and cholera. Since the beginning of the rainy/cyclonic season, 1.4 million people have been affected by natural disasters with 314 deaths; 1,043 schools destroyed, affecting about 1.2 million students, and 133,979 hectares of land lost.
An estimated 480,593 people have received some form of assistance in areas affected by Cyclone Freddy, floods and cholera. In the worse affected districts, a quarter of the people targeted have received direct humanitarian assistance, including in Mutarara district that has become accessible.
The short cycle planting season that begins in May provides an opportunity for people to resume their livelihoods by September.
Cholera cases continue to be reported. As of 16 May, 30,509 cases were reported across ten provinces.
The Cholera, Cyclone and Floods Response Plan was launched to support 815,000 people affected by the triple crisis, with a financial requirement of US $138 million. As of 16 May the plan has received $10.8 million.
SITUATION OVERVIEW
As of 16 May, 480,593 people have been reached with some form of assistance by over 44 humanitarian partners working across eight provinces and 80 districts. About 263,019 people have been reached with direct humanitarian assistance. In Zambezia province, the most affected by the triple crisis of cyclone Freddy, floods and cholera, 216,347 people have been reached with humanitarian assistance, out of a total caseload of 501,975 people. The latest information on the response, including the 5Ws response dashboard by district can be found here: https://response.reliefweb.int/mozambique . Cholera cases continue to be reported. As of 16 May, health authorities have reported 30,509 cumulative cases of cholera in 10 provinces of the country, with 131 deaths. The National Institute for Disaster Reduction and Risk Management (INGD) reports that as of 15 May, 17 accommodation centres hosting approximately 40,000 remain open in Niassa (5) and Tete (12). There has been a rise in food insecurity, with an estimated 3.15 million people experiencing severe acute food insecurity - i.e. IPC Phase 3 and above. Since the beginning of the rainy/cyclonic season, 1.4 million people have been affected by natural disasters with 314 deaths. A total of 133,979 hectares of land were lost. In addition, 1,043 schools were destroyed, affecting about 1.2 million students. Across the 10 most vulnerable districts in the provinces of Sofala (Caia, Cheringoma), Tete (Cidade de Tete, Doa, Mutarara) and Zambezia (Cidade de Quelimane, Inhassunge, Maganja da costa, Namacurra, Nicoadala), approximately 120,750 people, 25 per cent of the targeted population in these districts, have received direct humanitarian assistance. The district of Mutarara has become accessible. As recovery efforts to assist the communities in rebuilding their lives are multifaceted and will require time; in the meantime, humanitarian partners will focus on addressing most urgent life-saving needs. The Cholera, Cyclone and Floods Response Plan was launched to support 815,000 people affected by the triple crisis, with a financial requirement of U$138 million. Humanitarian needs outstrip the capacity of humanitarian organizations to respond. Without immediate additional resources, humanitarian partners will be forced to make impossible choices, and hundreds of thousands of people may not receive the assistance they need to survive. Urgent contributions are sought to support people affected by cholera, Cyclone and Floods. Sectors seek funding to replenish loans that enabled the immediate start of the response at the outset of the emergency. According to the Financial Tracking System (FTS), as of 16 May the Cholera, Cyclone and Floods Response Plan is eight per cent funded, having received $10.8 million.
Assessing forecasting models on prediction of the tropical cyclone Dineo and the associated rainfall over Botswana
- Weather and Climate Extremes 21(1)
- CC BY-NC-ND

- University of Botswana

- Ministry of the Environment and Tourism
Abstract and Figures

Discover the world's research
- 25+ million members
- 160+ million publication pages
- 2.3+ billion citations

- J Babatunde Abiodun
- A.T.R. Krishna Priya
- D. Madhivadhani

- Zacharia Jusa
- ACTA GEOPHYS

- Eleni Katragkou

- Robert Maisha
- Jonas Mphepya

- Am J Appl Sci

- JRE Lutjeharms

- INT J CLIMATOL

- GEOPHYS RES LETT
- Nick P. Bassill

- METEOROL APPL
- Recruit researchers
- Join for free
- Login Email Tip: Most researchers use their institutional email address as their ResearchGate login Password Forgot password? Keep me logged in Log in or Continue with Google Welcome back! Please log in. Email · Hint Tip: Most researchers use their institutional email address as their ResearchGate login Password Forgot password? Keep me logged in Log in or Continue with Google No account? Sign up
Information
- Author Services
Initiatives
You are accessing a machine-readable page. In order to be human-readable, please install an RSS reader.
All articles published by MDPI are made immediately available worldwide under an open access license. No special permission is required to reuse all or part of the article published by MDPI, including figures and tables. For articles published under an open access Creative Common CC BY license, any part of the article may be reused without permission provided that the original article is clearly cited. For more information, please refer to https://www.mdpi.com/openaccess .
Feature papers represent the most advanced research with significant potential for high impact in the field. A Feature Paper should be a substantial original Article that involves several techniques or approaches, provides an outlook for future research directions and describes possible research applications.
Feature papers are submitted upon individual invitation or recommendation by the scientific editors and must receive positive feedback from the reviewers.
Editor’s Choice articles are based on recommendations by the scientific editors of MDPI journals from around the world. Editors select a small number of articles recently published in the journal that they believe will be particularly interesting to readers, or important in the respective research area. The aim is to provide a snapshot of some of the most exciting work published in the various research areas of the journal.
Original Submission Date Received: .
- Active Journals
- Find a Journal
- Proceedings Series
- For Authors
- For Reviewers
- For Editors
- For Librarians
- For Publishers
- For Societies
- For Conference Organizers
- Open Access Policy
- Institutional Open Access Program
- Special Issues Guidelines
- Editorial Process
- Research and Publication Ethics
- Article Processing Charges
- Testimonials
- Preprints.org
- SciProfiles
- Encyclopedia
Article Menu

- Subscribe SciFeed
- Recommended Articles
- Google Scholar
- on Google Scholar
- Table of Contents
Find support for a specific problem in the support section of our website.
Please let us know what you think of our products and services.
Visit our dedicated information section to learn more about MDPI.
JSmol Viewer
Comparative impact analysis of cyclone ana in the mozambique channel using satellite data.

1. Introduction
1.1. an introduction to flooding, 1.2. relationship between mangrove ecosystems & cyclones, 1.3. knowledge gap, 1.4. study objectives.
- Are there differences in the climatic and anthropogenic impacts after TCs in coastal Mozambique and Madagascar?
- Specifically, were mangrove forests degraded after the TC? Were there regional differences in the degradation extent and pattern? For example, do areas in the vicinity of the mangrove hit by the TC fare better than non-mangrove areas?
2. Materials and Methods
2.1. study area, 2.2. an overview of tropical cyclone ana, 2.3. impact assessment, 2.3.1. flood model, 2.3.2. socio-ecological flood impacts model, 4. discussion, 4.1. impact numbers in the mozambique channel, 4.2. spatial and regional trends, 4.3. beneficial impact of mangrove forests in flood mitigation, 4.4. sociological impact of flooding, 4.5. limitations, 5. conclusions, supplementary materials, author contributions, institutional review board statement, informed consent statement, data availability statement, conflicts of interest.
- Charrua, A.; Padmanaban, R.; Cabral, P.; Bandeira, S.; Romeiras, M. Impacts of the Tropical Cyclone Idai in Mozambique: A Multi-Temporal Landsat Satellite Imagery Analysis. Remote Sens. 2021 , 13 , 201. [ Google Scholar ] [ CrossRef ]
- Ouyang, Y.; Grace, J.; Parajuli, P.; Caldwell, P. Impacts of Multiple Hurricanes and Tropical Storms on Watershed Hydrological Processes in the Florida Panhandle. Climate 2022 , 10 , 42. [ Google Scholar ] [ CrossRef ]
- National Oceanic and Atmospheric Administration 2015. Available online: https://www.ncei.noaa.gov/access/monitoring/monthly-report/global/201513 (accessed on 1 March 2023).
- McBride, J.; Zehr, R. Observational Analysis of Tropical Cyclone Formation. Part II: Comparison of Non-Developing versus Developing Systems. J. Atmos. Sci. 1981 , 38 , 1132–1151. [ Google Scholar ] [ CrossRef ]
- Matyas, C. Tropical cyclone formation and motion in the Mozambique Channel. Int. J. Climatol. 2014 , 35 , 375–390. [ Google Scholar ] [ CrossRef ]
- ACAPS. Madagascar Tropical Cyclones Season in 2022. 2022. Available online: https://www.acaps.org/country/madagascar/crisis/tropical-cyclones-season-in-2022 (accessed on 11 November 2022).
- UNOCHA. Madagascar. Available online: https://www.unocha.org/southern-and-eastern-africa-rosea/madagascar (accessed on 11 November 2022).
- Cabral, P.; Augusto, G.; Akande, A.; Costa, A.; Amade, N.; Niquisse, S.; Atumane, A.; Cuna, A.; Kazemi, K.; Mlucasse, R.; et al. Assessing Mozambique’s exposure to coastal climate hazards and erosion. IJDRR 2017 , 23 , 45–52. [ Google Scholar ] [ CrossRef ]
- Giri, C.; Muhlhausen, J. Mangrove Forest Distributions and Dynamics in Madagascar (1975–2005). Sensors 2008 , 8 , 2104–2117. [ Google Scholar ] [ CrossRef ] [ Green Version ]
- Mathew, A.; Kumar, S.; Vivek, G.; Iyyappan, M.; Karthikaa, R.; Kumar, P.; Dash, S.; Gopinath, G.; Usha, T. Flood impact assessment using field investigations and post-flood survey. J. Earth Syst. Sci. 2021 , 130 , 147. [ Google Scholar ] [ CrossRef ]
- Arnell, N.; Gosling, S. The impacts of climate change on river flood risk at the global scale. Clim. Ch. 2014 , 134 , 387–401. [ Google Scholar ] [ CrossRef ] [ Green Version ]
- Lequechane, J.; Mahumane, A.; Chale, F.; Nhabomba, C.; Salomão, C.; Lameira, C.; Chicumbe, S.; Semá, B.C. Mozambique’s response to cyclone Idai: How Collaboration and Surveillance with Water, Sanitation and Hygiene (WASH) Interventions were used to Control a Cholera Epidemic. Infect. Dis. Poverty 2020 , 9 , 121–124. [ Google Scholar ] [ CrossRef ]
- Talbot, C.; Bennett, E.; Cassell, K.; Hanes, D.; Minor, E.; Paerl, H.; Raymond, P.; Vargas, R.; Vidon, P.; Wollheim, W.; et al. The Impact of Flooding on Aquatic Ecosystem Services. Biogeochemistry 2018 , 141 , 439–461. [ Google Scholar ] [ CrossRef ] [ Green Version ]
- Gotkowitz, M.; Attig, J.; McDermott, T. Groundwater Flood of a River Terrace in Southwest Wisconsin, USA. Hydrogeol. J. 2014 , 22 , 1421–1432. [ Google Scholar ]
- Charrua, A.; Bandeira, S.; Catarino, S.; Cabral, P.; Romeiras, M. Assessment of the vulnerability of coastal mangrove ecosystems in Mozambique. Ocean Coast. Manag. 2020 , 189 , 105145. [ Google Scholar ] [ CrossRef ]
- Alongi, D. Present State and Future of the World’s MANGROVE Forests. Environ. Conserv. 2002 , 29 , 331–349. [ Google Scholar ] [ CrossRef ] [ Green Version ]
- Blankespoor, B.; Dasgupta, S.; Lange, G. Mangroves as a Protection from Storm Surges in a Changing Climate. Ambio 2016 , 46 , 478–491. [ Google Scholar ] [ CrossRef ]
- Krauss, K.; McKee, K.; Lovelock, C.; Cahoon, D.; Saintilan, N.; Reef, R.; Chen, L. How Mangrove Forests Adjust to Rising Sea Level. New Phytol. 2013 , 202 , 19–34. [ Google Scholar ] [ CrossRef ] [ Green Version ]
- Barbosa, F.; Cuambe, C.; Bandeira, S. Status and distribution of mangroves in Mozambique. S. Afr. J. Bot. 2001 , 67 , 393–398. [ Google Scholar ]
- Fatoyinbo, T.; Simard, M. Height and biomass of mangroves in Africa from ICESat/GLAS and SRTM. Int. J. Remote Sens. 2013 , 34 , 668–681. [ Google Scholar ] [ CrossRef ]
- Sitoe, A.; Mandlate, L.; Guedes, B. Biomass and Carbon Stocks of Sofala Bay Mangrove Forests. Forests 2015 , 5 , 1967–1981. [ Google Scholar ] [ CrossRef ]
- Skakun, S. A Neural Network Approach to Flood Mapping Using Satellite Imagery. Comput. Inform. 2010 , 29 , 1013–1024. [ Google Scholar ]
- Jones, T.; Glass, L.; Gandhi, S.; Ravaoarinorotsihoarana, L.; Carro, A.; Benson, L.; Ratsimba, H.; Giri, C.; Randriamanatena, D.; Cripps, G. Madagascar’s Mangroves: Quantifying Nation-Wide and Ecosystem Specific Dynamics, and Detailed Contemporary Mapping of Distinct Ecosystems. Remote Sens. 2016 , 8 , 106. [ Google Scholar ]
- Tropical Storm Ana 2022. Available online: https://zoom.earth/storms/ana-2022/#map=daily (accessed on 30 August 2022).
- FAO Crop Calendar. Available online: https://cropcalendar.apps.fao.org/#/home (accessed on 11 November 2022).
- Kussul, N.; Shelestov, A.; Skakun, S. Flood Monitoring on the Basis of SAR Data. In Use of Satellite and In-Situ Data to Improve Sustainability ; Kogan, F., Powell, A., Fedorov, O., Eds.; NATO Science for Peace and Security Series C: Environmental Security; Springer: Berlin/Heidelberg, Germany, 2011; pp. 19–29. [ Google Scholar ]
- Kussul, N.; Shelestov, A.; Skakun, S. Grid System for Flood Extent Extraction from Satellite Images. Earth Sci. Inform. 2008 , 1 , 105–117. [ Google Scholar ] [ CrossRef ] [ Green Version ]
- Kussul, N.; Shelestov, A.; Skakun, S.; Li, G.; Kussul, O.; Xie, J. Service-oriented infrastructure for flood mapping using optical and SAR satellite data. Int. J. Digit. Earth 2014 , 7 , 829–845. [ Google Scholar ] [ CrossRef ]
- Kussul, N.; Shelestov, A.; Skakun, S.; Li, G.; Kussul, O. The Wide Area Grid Testbed for Flood Monitoring Using Earth Observation Data. IEEE J. Sel. Top. Appl. Earth Obs. Remote Sens. 2012 , 5 , 1746–1751. [ Google Scholar ] [ CrossRef ]
- Kussul, N.; Shelestov, A.; Skakun, S. Grid and Sensor Web Technologies for Environmental Monitoring. Earth Sci. Inform. 2009 , 2 , 37–51. [ Google Scholar ] [ CrossRef ] [ Green Version ]
- Fischell, L.; Lüdtke, D.; Duguru, M. Capabilities of SAR and Optical Data for Rapid Mapping of Flooding Events. 2018. Available online: http://geomundus.org/2018/docs/papers/Lisa.pdf (accessed on 11 November 2022).
- Hoque, M.; Phinn, S.; Roelfsema, C.; Childs, I. Assessing tropical cyclone impacts using object-based moderate spatial resolution image analysis: A case study in Bangladesh. Int. J. Remote Sens. 2016 , 37 , 5320–5343. [ Google Scholar ] [ CrossRef ]
- Bhowmik, A.; Cabral, P. Cyclone Sidr Impacts on the Sundarbans Floristic Diversity. Earth Sci. Res. 2013 , 2 , 62. [ Google Scholar ] [ CrossRef ] [ Green Version ]
- Web of Science Group. Available online: https://mjl.clarivate.com/search-results (accessed on 1 March 2023).
- Zanaga, D.; Van De Kerchove, R.; De Keersmaecker, W.; Souverijns, N.; Brockmann, C.; Quast, R.; Wevers, J.; Grosu, A.; Paccini, A.; Vergnaud, S.; et al. ESA WorldCover 10 m 2020 (Version v100). Available online: https://zenodo.org/record/5571936#.Y3zMW0nMK70 (accessed on 11 November 2022).
- Mozambique: Tropical Storm Ana Flash Report Update 1: Damages Recorded in the Communities Assessed-Zambezia Province. Available online: https://dtm.iom.int/reports/mozambique-%E2%80%94-tropical-storm-ana-flash-report-update-1-%E2%80%94-damages-recorded-communities-0 (accessed on 11 November 2022).
- Tropical Storm Ana: Jan 2022. Available online: https://reliefweb.int/disaster/st-2022-000088-moz (accessed on 30 August 2022).
- Kolstad, E. Prediction and precursors of Idai and 38 other tropical cyclones and storms in the Mozambique Channel. Q. J. R. Meteorol. Soc. 2020 , 147 , 45–57. [ Google Scholar ] [ CrossRef ]
- Cyclone et Activite Cyclonique par Météo-France La Réunion. Available online: https://meteofrance.re/fr/cyclone (accessed on 11 November 2022).
- Ballesteros, C.; Esteves, L. Integrated Assessment of Coastal Exposure and Social Vulnerability to Coastal Hazards in East Africa. Estuaries Coasts 2021 , 44 , 2056–2072. [ Google Scholar ] [ CrossRef ]
- Rubinato, M.; Nichols, A.; Peng, Y.; Zhang, J.; Lashford, C.; Cai, Y.; Lin, P.; Tait, S. Urban and river flooding: Comparison of flood risk management approaches in the UK and China and an assessment of future knowledge needs. Water Sci. Eng. 2019 , 12 , 274–283. [ Google Scholar ] [ CrossRef ]
- Ramiaramanana, F.; Teller, J. Urbanization and Floods in Sub-Saharan Africa: Spatiotemporal Study and Analysis of Vulnerability Factors: Case of Antananarivo Agglomeration (Madagascar). Water 2021 , 13 , 149. [ Google Scholar ] [ CrossRef ]
- Farr, T.G.; Rosen, P.A.; Caro, E.; Crippen, R.; Duren, R.; Hensley, S.; Kobrick, M.; Paller, M.; Rodriguez, E.; Roth, L.; et al. The Shuttle Radar Topography Mission. Rev. Geophys. 2007 , 45 , 1–43. [ Google Scholar ] [ CrossRef ] [ Green Version ]
Click here to enlarge figure
| Data (Index Type) | Data Name | Source | Spatial Resolution | Temporal Coverage |
|---|---|---|---|---|
| Land Cover Classification | CGLOPS Land Cover Classification | Copernicus: ESA- VITO | 10 m | Static: 2020 |
| Population Density | World Population Density: Madagascar | World Pop Hub | 1 km | Static: 2018 & 2019 |
| World Population Density: Mozambique | ||||
| Mangrove Degradation (NDVI) | Sentinel 2 | ESA | 15 m | 2013–2022 |
| Sentinel 1 SAR—GRD | 5 × 20 m | 2017–2022 | ||
| Flooding Model | JRC—Global Surface Water Mapping Layers v1.3 | EC JRC | 30 m | 1981–2021 |
| SRTM DEM—void filled | ESA | 15 m | Static: 2015 | |
| CGLOPS Land Cover Classification | Copernicus ESA—VITO | 10 m | Static: 2020 |
| Region | Area Affected by Flood (ha) | Relative Area Flooded (%) | Number of Exposed Population | Relative Exposed Population (%) | Affected Urban Areas (ha) | Relative Affected Urban Areas (%) | |
|---|---|---|---|---|---|---|---|
| Zambezia | 595,872 | 5.78% | 87,577 | 1.71% | 6741 | 1.13% | |
| Sofala | 456,120 | 6.71% | 108,400 | 4.80% | 7860 | 1.72% | |
| Boeny | 451,731 | 14.55% | 66,591 | 7.15% | 4042 | 0.89% | |
| Melaky | 254,984 | 6.56% | 12,412 | 4.01% | 767 | 0.30% |
| The statements, opinions and data contained in all publications are solely those of the individual author(s) and contributor(s) and not of MDPI and/or the editor(s). MDPI and/or the editor(s) disclaim responsibility for any injury to people or property resulting from any ideas, methods, instructions or products referred to in the content. |
Share and Cite
Singh, M.; Schoenmakers, E. Comparative Impact Analysis of Cyclone Ana in the Mozambique Channel Using Satellite Data. Appl. Sci. 2023 , 13 , 4519. https://doi.org/10.3390/app13074519
Singh M, Schoenmakers E. Comparative Impact Analysis of Cyclone Ana in the Mozambique Channel Using Satellite Data. Applied Sciences . 2023; 13(7):4519. https://doi.org/10.3390/app13074519
Singh, Minerva, and Emma Schoenmakers. 2023. "Comparative Impact Analysis of Cyclone Ana in the Mozambique Channel Using Satellite Data" Applied Sciences 13, no. 7: 4519. https://doi.org/10.3390/app13074519
Article Metrics
Article access statistics, supplementary material.
ZIP-Document (ZIP, 99 KiB)
Further Information
Mdpi initiatives, follow mdpi.
Subscribe to receive issue release notifications and newsletters from MDPI journals
- Skip to main content
- Keyboard shortcuts for audio player
Cyclone Freddy wrecks Malawi and Mozambique, killing more than 200 people
The Associated Press
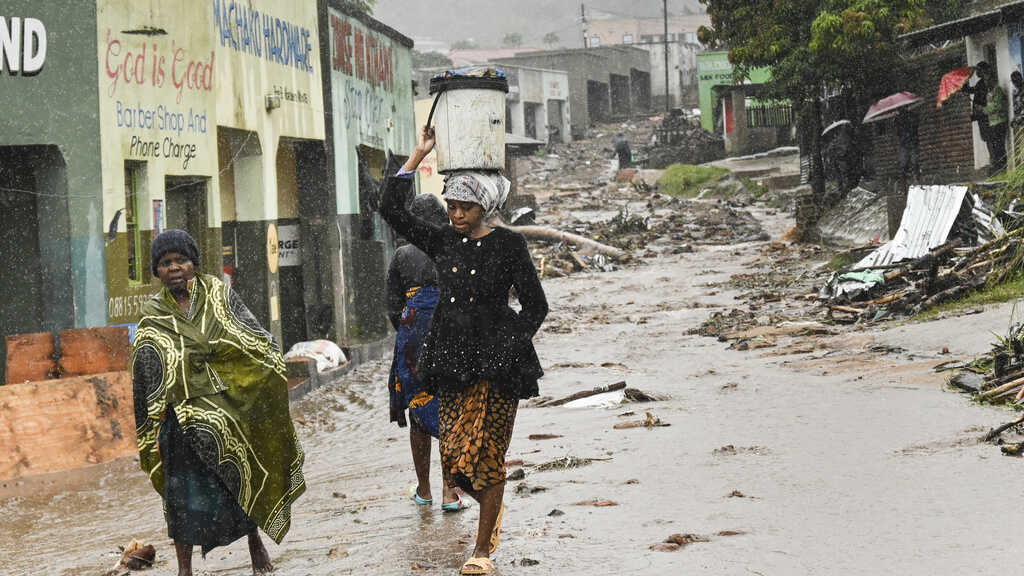
Women walk to a nearby displacement center in Blantyre, Malawi, on Tuesday. The unrelenting Cyclone Freddy, which is still battering southern Africa, has killed hundreds of people in Malawi and Mozambique since it struck the continent for a second time on Saturday night. Thoko Chikondi/AP hide caption
Women walk to a nearby displacement center in Blantyre, Malawi, on Tuesday. The unrelenting Cyclone Freddy, which is still battering southern Africa, has killed hundreds of people in Malawi and Mozambique since it struck the continent for a second time on Saturday night.
BLANTYRE, Malawi — The devastating Tropical Cyclone Freddy which has ripped through southern Africa in a rare second landfall has killed at least 216 people in Malawi and Mozambique since Saturday night, with the death toll expected to rise.
Heavy rains that triggered floods and mudslides have killed 199 people in Malawi, authorities said Tuesday. President Lazarus Chakwera declared a "state of disaster" in the country's southern region and the now-ravaged commercial capital, Blantyre. Some 19,000 people in the south of the nation have been displaced, according to Malawi's disaster management directorate.

Goats and Soda
Mozambique is racing to adapt to climate change. the weather is winning.
"Power and communications are down in many affected areas, hindering aid operations," said Stephane Dujarric, the U.N. Secretary General's spokesperson at a press briefing Tuesday afternoon. The most affected regions remain inaccessible so the full extent of the damage is so far unknown.
Reports from Mozambique's disaster institute on Tuesday confirmed that 17 people have died in the country and 1,900 homes have been destroyed in the coastal Zambezia province. Tens of thousands of people are still holed up in storm shelters and accommodation centers.
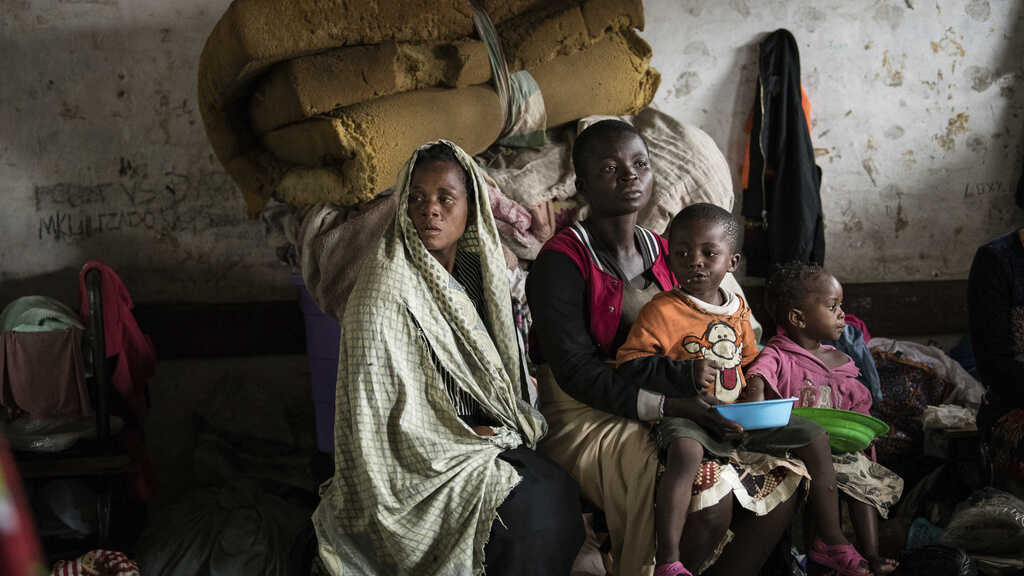
Mothers and their children sit Tuesday at a displacement center in Blantyre, Malawi. Thoko Chikondi/AP hide caption
Mothers and their children sit Tuesday at a displacement center in Blantyre, Malawi.
Freddy will continue to thump central Mozambique and southern Malawi with extreme rainfall before it exits back to the sea late Wednesday afternoon, the U.N.'s meteorological center on the island of Réunion projected.
Human rights group Amnesty International has called on the international community to mobilize resources and boost aid and rescue efforts in the two countries. Relief efforts in the nations are strained and were already battling a cholera outbreak when Freddy struck.
"It is clear that the official death toll will rise in both Malawi and Mozambique, as will reports of wrecked infrastructure," saidTigere Chagutah, Amnesty International's east and southern Africa director. "The affected countries must also be compensated for loss and damage caused by the cyclone."

The unbelievable crocodile problem in Mozambique
In November last year, nations agreed to compensate countries affected by extreme weather exacerbated by human-caused climate change. Cyclones are wetter, more frequent and more intense as the planet heats up, scientists say.
"Mozambique and Malawi are among the countries least responsible for climate change, yet they are facing the full force of storms that are intensifying due to global warming driven mostly by carbon emissions from the world's richest nations," Chagutah added.

A road connecting the cities of Blantyre and Lilongwe is seen damaged Tuesday in Malawi following heavy rains caused by Tropical Cyclone Freddy. Thoko Chikondi/AP hide caption
A road connecting the cities of Blantyre and Lilongwe is seen damaged Tuesday in Malawi following heavy rains caused by Tropical Cyclone Freddy.
Cyclone Freddy has been causing destruction in southern Africa since late February. It also pummeled the island states of Madagascar and Réunion last month as it traversed across the Indian Ocean.
The cyclone has intensified a record seven times and has the highest-ever recorded accumulated cyclone energy, or ACE, which is a measurement of how much energy a cyclone has released over time. Freddy recorded more energy over its lifetime than an entire typical U.S. hurricane season.

Environment
In malawi, a greener revolution aligns diet and land.
Freddy first developed near Australia in early February and is set to be the longest-ever recorded tropical cyclone. The U.N.'s weather agency has convened an expert panel to determine whether it has broken the record set by Hurricane John in 1994 of 31 days.
- tropical cyclone

Members of the public and military personnel search for survivors and bodies in Ngangu township Chimanimani in eastern Zimbabwe, after Cyclone Idai.
- ENVIRONMENT
Why Cyclone Idai was so destructive
The storm that battered Mozambique and its neighbors in Africa followed a winding path.
Cyclone Idai may have killed more than 1,000 people and left 400,000 homeless near the port city of Beira in the southeastern African nation of Mozambique. It may be the worst weather-related disaster ever to hit the southern hemisphere, with 1.7 million people in the path of the cyclone in Mozambique and 920,000 affected in neighboring Malawi, U.N. officials told the BBC on Tuesday.
“The scale of suffering and loss is still not clear, and we expect that the number of people affected as well as the number of people who have lost their lives may rise,” said Jamie LeSueur of the International Federation of Red Cross and Red Crescent Societies (IFRC) in a statement .
Idai made landfall on March 15 with winds up to 100 miles an hour and a storm surge topping 20 feet. Heavy rains accompanied the storm and have continued with six more inches forecast for today, March 19, and not expected to end until March 21, according to the Mozambique National Meteorology Institute forecast .
Flooding is widespread throughout central Mozambique, with roads and bridges washed out, said Gregory Carr, president of the Gorongosa National Park , an area roughly the size of Rhode Island that is located 100 miles inland from Beira. “We’re right in the middle of the impacted area,” Carr said.
The protective power of parks
“I’ve been on the phone all morning trying to arrange for U.S. food aid to be helicoptered to our airstrip so we can distribute it to neighboring communities,” Carr said.
At Gorongosa, the stated purpose of the park is to both protect wildlife and meet the needs of nearby communities by providing employment, health care, education, and other services, Carr noted. Now they’re doing disaster relief. “The roads are out but our 260 rangers are great walkers,” Carr said.
Some of the park’s 260 rangers are waste deep in water delivering supplies to people stranded on termite mounds, one patrol leader told Carr today. They plan to return with canoes to rescue them.
About half of the park is underwater, but Carr expects minimal impact on animals as they will likely move to higher ground. However, a flooded park means there’s less water to flood local communities. In fact, flood prevention is one of the big benefits of national parks, forests, and natural areas, he said. During droughts, parks and forests are often sources of water and cooling for local regions. “We need wilderness to moderate the impacts of extreme weather events from climate change,” said Carr.
A big u-turn
Mozambique averages about 1.5 tropical cyclones a year and, although rarely more powerful than Category 2, they can cause a lot of damage, said Corene Matyas, a tropical cyclone researcher at the University of Florida.
Flooding is the main problem affecting most people from the storms. With climate change the atmosphere now holds more moisture (because it’s warmer, on average), and that means there may be more water available for heavy rainfalls, Matyas said.
Cyclone Idai also had a loopy lifespan. It was born March 4th just off the coast in the very warm waters of the Mozambique Channel—a 250 mile-wide arm of the Indian Ocean between Mozambique and the island of Madagascar. Idai came ashore as a weak tropical storm in northern Mozambique and then wandered back out into the channel before doing a u-turn off the western coast of Madagascar March 11. It then made a beeline for its landfall at the city of Beira on the 15th.
“That kind of looping, unpredictable storm track isn’t uncommon for cyclones that start in the channel,” Matyas said.
The ongoing flooding in central Mozambique likely means that the major food-producing region of the north is cut off from the heavily populated south, where the capital city of Maputo is located, she said.
Most tropical cyclone activity in the southwest Indian Ocean occurs between October and May, with activity peaking in mid-January and again in mid-February to early March. Idai is the seventh intense tropical cyclone of the basin’s 2018-2019 season, according to NASA .
Related Topics
- NATIONAL PARKS
You May Also Like
What are hurricanes, typhoons, and cyclones?
The link between extreme weather and climate change has never been more clear
2024 hurricane season forecasted to be record-breaking year

5 reasons why flying is becoming more dangerous

Nature really is good medicine. Science can explain why.
- Photography
- Environment
History & Culture
- History & Culture
- History Magazine
- Paid Content
- Terms of Use
- Privacy Policy
- Your US State Privacy Rights
- Children's Online Privacy Policy
- Interest-Based Ads
- About Nielsen Measurement
- Do Not Sell or Share My Personal Information
- Nat Geo Home
- Attend a Live Event
- Book a Trip
- Inspire Your Kids
- Shop Nat Geo
- Visit the D.C. Museum
- Learn About Our Impact
- Support Our Mission
- Advertise With Us
- Customer Service
- Renew Subscription
- Manage Your Subscription
- Work at Nat Geo
- Sign Up for Our Newsletters
- Contribute to Protect the Planet
Copyright © 1996-2015 National Geographic Society Copyright © 2015-2024 National Geographic Partners, LLC. All rights reserved
Content Search
Acaps briefing note – mozambique: impact of tropical cyclone eloise (17 february 2021).
- Start Network
Attachments

Tropical Cyclone Eloise reached the coast of Mozambique on 23 January, with winds of around 140km/h and gusts of up to 160km/h (category 2 tropical cyclone equivalent). It affected Sofala, Manica, the southern part of Zambezia, Inhambane, and Gaza provinces (Protection Cluster 31/01/2021; INGD 23/01/2021). The epicentre of the cyclone hit Buzi district and brought heavy rainfall that caused Chicamba Dam and Mavuzi Reservoir to overflow.
The resulting flooding affected the residents of Vila Sede, Guara-Guara, Ampara, Grudja, Estaquinha, Inhamuchindo, and Bândua localities in Buzi district (DTM, INGD 31/01/2021). Other affected districts are Dondo Nhamatanda and Chibabava in Sofala (DTM, INGD 05/02/2021). Tropical Cyclone Eloise has led to the deaths of 11 people (ECHO 29/01/2021).
Cyclone Eloise affected 314,000 people, including more than 20,012 people who are living in 31 temporary accommodation centres in Sofala and Inhambane provinces (30 centres in Sofala and one in Inhambane) (DTM, INGD 05/02/2021; OCHA 29/01/2021). 29,310 houses were affected: 17,738 were destroyed, 8,565 were damaged, and 3,007 were flooded, mainly in Sofala province. At least 579 classrooms and 86 health centres will need repairs (DTM, INGD 31/01/2021; Protection Cluster 31/01/2021; OCHA 29/01/2021).
Prior to Eloise, heavy rains had already affected at least 3,917 hectares of farmland in Buzi district. 242,000 hectares of crops were destroyed in areas hit by Eloise (IFRC 12/02/2021; IFRC 29/01/2021; DTM, INGD 31/01/2021). The priority needs reported in all of the accommodation centres are food, followed by water and shelter (DTM, INGD 31/01/2021).
From 9 January until 23 January when Eloise made landfall in Mozambique, the provinces of Inhambane, Manica, Niassa, Sofala, Tete, and Zambezia received heavy rains (IFRC 22/01/2021). Sofala province and the entire Zambezi Basin also experienced heavy rainfall, strong winds, and flooding prior to Eloise. The districts hit hardest by the heavy rains were Beira (neighbourhoods Mungassa and Ndunda I e II), Buzi, Muanza, Caia, Dondo, Marromeu, and Nhamatanda. The pre-cyclone rains affected more than 21,500 people and more than 1,900 houses (ECHO 23/01/2021; OCHA 22/01/2021).
Related Content
Mozambique: central region - multi-sectoral location assessment - (manica, sofala and zambezia provinces) | round 22 - march, 2022, mozambique: central region - multi-sectoral location assessment - round 20 (tropical cyclone eloise aftermath) (data collection period: 18 march - 14 april 2021), mozambique: cabo delgado and nampula - multi-sectoral location assessment - round 3 (june 2021), mozambique: tropical cyclone eloise - multi-sectoral location assessment, accommodation centres - tropical cyclone eloise aftermath (data collection period: 28 january - 05 february 2021).
- 1. Introduction
- a. Impact of the zonal steering flow
- b. Impact of SIO SSTs
- c. Impact of the vertical wind shear
- d. Role of El Niño–Southern Oscillation (ENSO)
- a. Impact of ENSO
- b. Impact of local SSTs
- c. Conclusion of the sensitivity experiments
- 4. Forecasting the risk of landfall over Mozambique
- 5. Conclusions
Bove , M. C. , J. B. Elsner , C. W. Landsea , X. Niu , and J. J. O’Brien , 1998 : Effect of El Niño on U.S. landfalling hurricanes, revisited. Bull. Amer. Meteor. Soc. , 79 , 2477 – 2482 .
- Search Google Scholar
- Export Citation
Chan , J. C. L. , J. E. Shi , and C. M. Lam , 1998 : Seasonal forecasting of tropical cyclone activity over the western North Pacific and the South China Sea. Wea. Forecasting , 13 , 997 – 1004 .
Dong , K. , and C. J. Neumann , 1986 : The relationship between tropical cyclone motion and environmental geostrophic flows. Mon. Wea. Rev. , 114 , 115 – 222 .
Frank , W. M. , 1987 : Tropical cyclone formation. A Global View of Tropical Cyclones, R. L. Elsberry, Ed., Office of Naval Research, 53–90 .
Goldenberg , S. G. , and L. J. Shapiro , 1996 : Physical mechanism for the association of El Niño and west African rainfall with Atlantic major hurricane activity. J. Climate , 9 , 1169 – 1187 .
Gray , W. M. , 1979 : Hurricanes: Their formation, structure and likely role in the tropical circulation. Meteorology over the Tropical Oceans, D. B. Shaw, Ed., Royal Meteorological Society, 155–218 .
Gray , W. M. , 1984 : Atlantic seasonal hurricane frequency. Part I: El Niño and 30 mb quasi-biennal oscillation influences. Mon. Wea. Rev. , 112 , 1649 – 1668 .
Gray , W. M. , C. W. Landsea , P. W. Mielke Jr. , and K. J. Berry , 1992 : Predicting Atlantic seasonal hurricane activity 6–11 months in advance. Wea. Forecasting , 7 , 440 – 455 .
Holland , G. , 1983 : Tropical cyclone motion: Environmental interaction plus beta effect. J. Atmos. Sci. , 40 , 328 – 342 .
Jury , M. R. , N. Pathack , and B. Parker , 1999 : Climatic determinants and statistical prediction of tropical cyclone days in the southwest Indian Ocean. J. Climate , 12 , 3369 – 3372 .
Kalnay , E. , and Coauthors . 1996 : The NCEP/NCAR 40-Year Reanalysis Project. Bull. Amer. Meteor. Soc. , 77 , 431 – 471 .
Knuth , D. E. , 1981 : Seminumerical Algorithms. Vol. 2. The Art of Computer Programming. Addison-Wesley, 688 pp .
Neumann , C. J. , B. R. Jarvinen , C. J. McAdie , and J. D. Elms , 1993 : Tropical Cyclones of the North Atlantic Ocean, 1871–1992 . Historical Climatology Series, Vol. 6-2, NOAA, 193 pp .
Nicholls , N. , 1992 : Recent performance of a method for forecasting Australian seasonal tropical cyclone activity. Aust. Meteor. Mag. , 21 , 105 – 110 .
Palmer , T. N. , 2001 : A nonlinear dynamic perspective of model error: A proposal for non-local stochastic–dynamic parameterization in weather and climate prediction models. Quart. J. Roy. Meteor. Soc. , 127 , 279 – 304 .
Palmer , T. N. , R. Gelaro , J. Barkmeijer , and R. Buizza , 1998 : Singular vectors, metrics, and adaptative observations. J. Atmos. Sci. , 55 , 633 – 653 .
Saunders , M. A. , and A. R. Harris , 1997 : Sea warming as a dominant factor behind near-record numbers of Atlantic hurricanes. Geophys. Res. Lett. , 24 , 1255 – 1258 .
Vitart , F. , and J. L. Anderson , 2001 : Sensitivity of Atlantic tropical storm frequency to ENSO and interdecadal variability of SSTs in an ensemble of AGCM integrations. J. Climate , 14 , 533 – 545 .
Vitart , F. , and T. N. Stockdale , 2001 : Seasonal forecasting of tropical storms using coupled GCM integrations. Mon. Wea. Rev. , 129 , 2521 – 2537 .
Vitart , F. , J. L. Anderson , and W. F. Stern , 1997 : Simulation of the interannual variability of tropical storm frequency in an ensemble of GCM integrations. J. Climate , 10 , 745 – 760 .
Xie , S-P. , H. Annamalai , F. A. Schott , and J. P. McCreary Jr. , 2002 : Structure and mechanisms of South Indian Ocean climate variability. J. Climate , 15 , 864 – 878 .
Tropical storm tracks observed during the tropical cyclone seasons of (top) 2000, (middle) 1999, and (bottom) 1998. Squares represent the tropical cyclone’s first position. This figure suggests that the tracks of tropical cyclones over the South Indian Ocean can display a significant variability between two seasons
Interannual variability of the zonal steering flow (defined as the zonal mean flow averaged from 200 to 850 mb) over the SIO (10°–25°S, 40°–100°E) averaged from 1 Jan to 31 Mar. The mean is close to 0 m s –1 . Crosses indicate years with landfall, squares years with La Niña conditions, and diamonds years with El Niño conditions. El Niño and La Niña seasons are defined as the seasons when the Niño-3.4 SSTs averaged over the period Jan–Mar are one std dev above and below the 1950–2000 climatology
Observed tropical cyclone days per season on a 4° × 4° latitude grid when the zonal steering flow is (a) 1 std dev or more below climatology (defined over the period 1950–2000) and (b) 1 std dev or more above climatology. (c) The difference between (a) and (b). The contour interval is 0.5 tropical cyclone day and the first contour is 0.5 tropical cyclone day. Shaded areas represent regions with more than 1 tropical cyclone day. Only tropical storms with a genesis location between 50° and 120°E have been considered
(a) Distribution of all the tropical cyclone seasons from 1950 to 2000 as a function of the zonal steering flow over the SIO ( x axis) and SIO SST anomaly ( y axis). Squares represent years with a landfall over Mozambique and circles years without a landfall. Four regions are defined. In region I, the SST anomaly is greater than 0 and the zonal steering flow is at least 1 std dev below climatology. This region displays the largest percentage of seasons with landfalls, and 2000 is within this region. Region II corresponds to zonal steering flow below at least 1 std dev and negative SST anomalies. The 1999 tropical cyclone season is in this region. Regions III and IV correspond to a zonal steering flow above about –0.9 m s –1 . These regions display the lowest frequency of tropical cyclone landfall. (b) Distribution of all the El Niño (circles) and La Niña seasons (squares) from 1950 to 2000 as a function of SIO SST anomaly ( y axis) and zonal steering flow over the SIO ( x axis)
Difference of zonal steering flow between (a) the zonal steering flow (m s –1 ) averaged over the period from 1 Dec 1999 to 1 Mar 2000 and the zonal steering flow averaged from 1 Dec 1997 to 1 Mar 1998 in the NCEP reanalysis, (b) EXP2000 minus EXP1998, (c) EXP1998_Pac minus EXP1998, and (d) EXP2000_Pac minus EXP1998. Dotted lines represent negative values. As shown, both EXP2000 and EXP2000_Pac simulate similar patterns with a significant reduction of zonal steering flow over the main SIO tropical storm development region. On the other hand, the difference between EXP1998_Pac and EXP1998 is much smaller in amplitude than between EXP2000 and EXP1998, suggesting that tropical Pacific SSTs are responsible for most of these anomalous patterns. In (b)–(d), regions where the KS test detects a confidence level in the difference lower than 95% are blanked out
Tropical cyclone tracks over the SIO detected when applying the objective procedure for tracking tropical cyclones to the ECMWF operation analysis interpolated to a 1.125° × 1.125° horizontal grid from Sep 1999 to Jun 2000
Tropical storm tracks simulated by the 20-member ensemble of (a) EXP2000, (b) EXP1998, (c) EXP2000_Pac, and (d) EXP1998_Pac. This figure shows a significant impact of the SST forcing on the simulated tropical cyclone distribution. The tropical cyclone activity west of Madagascar is significantly larger in EXP2000 and EXP2000_Pac than in EXP1998 and EXP1998_Pac
Distribution of tropical storm days simulated by (a) EXP2000 and (b) EXP1998, and (c) the difference of EXP2000 and EXP1998. Over each grid point, the number of tropical cyclone days has been normalized by the total number of tropical storm days simulated by each experiment over the entire SIO. The first contour is 0.02, and areas where the value exceeds 0.04 are shaded. This figure shows that tropical cyclones have significantly different tracks in EXP2000 than in EXP1998, consistent with observations in Fig. 3
Same as in Fig. 8 but for EXP2000_Pac instead of EXP2000. (c) The difference between EXP2000_Pac and EXP1998 is consistent with the difference between EXP2000 and EXP1998 in Fig. 8 (c)
Tropical cyclone tracks predicted by the 10-member ensemble during the 3 months of integration when starting from (a) 1 Jan 2000 and (b) from 1 Jan 1998. This figure suggests a significant interannual variability in the tracks of the tropical cyclones predicted by the coupled GCM
Interannual variability of the observed and predicted number of tropical storm landfalls over Mozambique. The predicted number of tropical storm landfalls has been calculated by taking the mean of the ensemble distribution, and multiplying it by 1.5, since the model simulates 1.5 less tropical cyclones than observed
- View raw image
- Download Powerpoint Slide
| All Time | Past Year | Past 30 Days | |
|---|---|---|---|
| Abstract Views | 0 | 0 | 0 |
| Full Text Views | 2297 | 314 | 14 |
| PDF Downloads | 1287 | 158 | 12 |
Related Content
The impacts of interannual climate variability on the declining trend in terrestrial water storage over the tigris–euphrates river basin, evaluation of snowfall retrieval performance of gpm constellation radiometers relative to spaceborne radars, a 440-year reconstruction of heavy precipitation in california from blue oak tree rings, quantifying the role of internal climate variability and its translation from climate variables to hydropower production at basin scale in india, extreme convective rainfall and flooding from winter season extratropical cyclones in the mid-atlantic region of the united states.
- Previous Article
- Next Article
Seasonal Forecasting of Tropical Cyclone Landfall over Mozambique
Displayed acceptance dates for articles published prior to 2023 are approximate to within a week. If needed, exact acceptance dates can be obtained by emailing [email protected] .
- Download PDF
The 2000 tropical cyclone season over the South Indian Ocean (SIO) was exceptional in terms of tropical cyclone landfall over Mozambique. Observed data suggest that SIO tropical cyclones have a track significantly more zonal during a La Niña event and tend to be more frequent when local SSTs are warmer. The combination of both conditions happened during the 2000 SIO tropical cyclone season and may explain the exceptional number of tropical cyclone landfalls over Mozambique during that season. A set of experiments using an atmospheric model of fairly high resolution ( T L 159, with a Gaussian grid spacing of 1.125°) forced by prescribed SSTs confirms the role of La Niña conditions and warmer local SSTs on the frequency of tropical cyclone landfalls over Mozambique. This also suggests that a numerical model can simulate the mechanisms responsible for the exceptional 2000 tropical cyclone season, and therefore could be used to explicitly predict the risk of landfall over Mozambique.
A coupled model with a T L 159 atmospheric component has been integrated for 3 months starting on 1 January of each year 1987–2001 to test this hypothesis. The hindcast produces significantly more tropical cyclone landfalls in 2000 than in any other year, and years with a predicted high risk of landfall generally coincide with years of observed tropical cyclone landfall.
Corresponding author address: Dr. Frédéric Vitart, European Centre for Medium-Range Weather Forecasts, Shinfield Park, Reading, RG2 9AX, United Kingdom. Email: [email protected]
The 2000 tropical cyclone season over the South Indian Ocean (SIO) was exceptional in term of tropical cyclone landfall over Mozambique, with serious consequences. In February 2000, Mozambique was already devastated by severe flooding after two weeks of steady rain before the landfall of Tropical Cyclone Eline with hurricane intensity (maximum sustained wind larger than 32 m s –1 ) on 25 February 2000. Eline brought more than 20 cm of precipitation per day over the already flooded region, creating a catastrophic situation. An estimated 700 people died and 2 million people were affected by the flood. At the beginning of April, a second tropical cyclone with hurricane intensity (Hudah) made a landfall over the northern part of Mozambique, but fortunately without the devastating consequences of Tropical Cyclone Eline.
Although tropical cyclones cannot be blamed for all the flooding over Mozambique, they played a dramatic role in worsening an already serious situation. Such strong tropical cyclone activity over Mozambique (two landfalls) is rare. According to historical records ( Neumann et al. 1993 ), Mozambique had been hit by more than one tropical cyclone only twice in the previous 60 yr (1962 and 1988), and never by more than one tropical cyclone with hurricane intensity. In most years, Mozambique does not suffer any tropical cyclone landfall, since tropical cyclones tend to have a southward recurvature well before reaching the Africa coast, thus sparing Mozambique. Therefore, the 2000 tropical cyclone season over the SIO can be viewed as exceptional and the seasonal forecast of tropical cyclone landfall over Mozambique could be a valuable tool for water resource management.
It would be excessively optimistic to think that the occurrence of one specific landfall could be predicted months in advance, since the synoptic conditions associated with that particular landfall have a predictability of the order of a few days at most. However, large-scale conditions, which might be predicted months in advance, can impact the frequency and tracks of tropical cyclones, and as a consequence the risk of landfall. The present paper will evaluate the predictability of the risk of landfall over Mozambique, using both observations and numerical model integrations. In section 2 , a 51-yr record of observed tropical cyclone tracks from Neumann et al. (1993) and reanalyses data from the National Centers for Environmental Prediction (NCEP; Kalnay et al. 1996 ) will be used in order to identify predictors and potential physical mechanisms responsible for the year-to-year change in the risk of landfall over Mozambique. Observations are not sufficient to prove all the relations, but lead into model studies in the third section, which will describe sensitivity experiments using an atmospheric general circulation model (AGCM) forced by prescribed sea surface temperatures (SSTs). The goal of these experiments is to isolate the impact of the different predictors on the simulated tropical cyclones. This will demonstrate the validity of the physical mechanisms identified in the observational study and confirm that they can be reproduced in a numerical model. Section 4 will evaluate the skill of a coupled GCM to explicitly predict the risk of landfall over Mozambique. The last section will present a discussion of the main results of this paper.
2. Observations
In the present paper, tropical cyclones are defined as tropical cyclonic systems with a maximum sustained wind larger than 17 m s –1 . The SIO is defined as the region west of 110°E. SIO tropical cyclones are defined as the tropical cyclones with at least a portion of their track within the SIO, though the genesis location does not necessarily need to be within SIO. Most SIO tropical cyclones occur during a specific period of the year—from September to April; the tropical cyclone season 2000, for example, refers to the period September 1999 to April 2000. All the statistics concerning observed tropical cyclones have been obtained from the Joint Typhoon Warning Center (JTWC, Guam), and Neumann et al. (1993) . The tropical cyclone record over the SIO prior to the use of meteorological satellites in the 1960s may be less reliable, since they were based mostly on ship reports. On the other hand, these statistics do not display any obvious difference between the periods prior to and after the introduction of satellite data, as is the case over the eastern North Pacific. The statistics concerning tropical cyclone landfall over Mozambique since 1950 may be reliable, because of the large population living in the area.
A comparison between the tropical cyclone tracks in 1998, 1999, and 2000 ( Fig. 1 ) indicates that SIO tropical cyclone tracks can display a significant variability from one season to another. In 2000, the tropical cyclone tracks were generally more zonal than in 1998, where all the tracks west of 80°E have a strong southward component. In 2000, the Tropical Cyclones Eline and Hudah had a genesis in the eastern edge of the basin with a landfall over Mozambique after weeks of a very unusual zonal track. In 1999, tropical cyclones’ tracks were also very zonal, but the number of intense tropical cyclones (maximum sustained wind larger than 34 m s –1 ) was significantly lower than climatology in 1999 and significantly higher in 2000. In 1998, the tropical storm tracks were more poleward than in 2000, and most tropical storms with a genesis location in the eastern part of the basin recurved east of Madagascar. None of these storms crossed Madagascar. However, a few tropical cyclone geneses took place over the Mozambique Channel, but these storms had a southeastward track most of the time. In this section, we will discuss what factors can explain the interannual variability in tropical cyclone frequency and tracks in the SIO, and how this impacts the risk of landfall over Mozambique using observed data.
The interannual variability of tropical cyclone statistics can often be related to the interannual variability of the large-scale circulation. The frequency of tropical cyclones is sensitive to the vertical shear of the horizontal wind, defined as the amplitude of the difference between the wind in the upper and the lower troposphere (see, e.g., Gray 1979 ; Frank 1987 ; Vitart and Anderson 2001 ) and SST anomalies ( Saunders and Harris 1997 ; Goldenberg and Shapiro 1996 ; Vitart and Anderson 2001 ). Low vertical wind shear and warm SST anomalies are conducive to more tropical cyclone activity. Variability in tropical cyclone tracks has also been related to the large-scale circulation. To a first order, tropical cyclone motion is attributed to the environmental wind circulation. Dong and Neumann (1986) indicate the optimum level of 400 mb for hurricanes and 700 mb for tropical cyclones for the Atlantic basin. However, vertical means over various depths of the atmosphere are usually considered for modeling the tracks of tropical cyclones rather than using a single level ( Holland 1983 ).
The zonal wind from the NCEP reanalysis ( Kalnay et al. 1996 ) has been vertically averaged from 200 to 850 mb over the SIO tropical cyclone main development region (10°–25°S, 40°–100°E) and has been averaged over the period from 1 January to 31 March (the peak period of the SIO tropical cyclone season). It will henceforth be referred to as the SIO zonal steering flow. Figure 2 displays the interannual variability of the SIO zonal steering flow from 1950 to 2000. Considering one single level instead of averaging over a vertical column would produce similar results. The SIO zonal steering flow displays a large interannual variability. It is not clear if the discontinuity around 1980 is due to a change in the quality of the atmospheric data or due to an interdecadal variability of the atmospheric circulation.
In order to evaluate if the interannual variability of the zonal steering flow is strong enough to generate an interannual variability of tropical cyclone motion, the mean tropical cyclone tracks have been evaluated over each SIO tropical cyclone season, when the zonal steering flow is at least one standard deviation above or below average (not shown). The direction of motion of each mean tropical cyclone track has been defined as the difference of longitude between day 5 and day 1 divided by the difference of latitude between day 5 and day 1. The Kolmogorov–Smirnov test (KS test; Knuth 1981 ) indicates that the direction of motion of the mean tropical cyclone tracks for the low steering-flow cases is significantly more zonal than in the high steering-flow cases with a confidence level higher than 97%.
This difference in tropical storm tracks is likely to impact significantly the spatial distribution of tropical cyclone days. Figure 3 displays a composite of the tropical cyclone days calculated from tropical cyclones with a genesis location between 50° and 120°E and over all the seasons when the zonal steering flow is at least one standard deviation below average ( Fig. 3a ) and at least one standard deviation above average ( Fig. 3b ). When the zonal steering flow is high, SIO tropical cyclones with a genesis location east of 50°E tend to recurve east of Madagascar and very few cross the island ( Fig. 3b ). However, when the zonal steering flow is low ( Fig. 3a ), the number of tropical cyclone days over the Mozambique Channel due to tropical cyclones crossing Madagascar (like Eline in 2000) is significantly higher than when the zonal steering flow is high ( Fig. 3c ). At this location, the amplitude of the difference represents 70% of the climatology, suggesting that the zonal steering flow has a significant impact on the tropical cyclone activity off the coast of Mozambique. Increased tropical cyclone activity to the west of Madagascar is likely to increase the risk of landfall over Mozambique.
Figure 3 does not include the tropical cyclones with a genesis location within the Mozambique Channel (west of 50°E) as these storms, which represent about 10% of the total number of SIO tropical cyclones, are usually short-lived and weak (see, e.g., Figs. 1b,c ). Therefore, they are usually less dangerous for Mozambique than the hurricanes with a genesis location east of 50°E, like Eline. Over the past 60 yr, Mozambique has been hit only once (in 1988) by a hurricane with a genesis location in the Mozambique Channel. The zonal steering flow does not seem to significantly impact the statistics of these tropical cyclones. However, even by including them, the total number of tropical cyclone days over the Mozambique Channel is still significantly higher with low steering flow than with high steering flow.
The years with tropical cyclone landfall are marked with a cross in Fig. 2 . According to the KS test, years with landfall display a zonal steering flow significantly more negative (95% confidence level) than years without landfall. During the past 50 yr, tropical cyclones have hit Mozambique during 25% of the total number of years. When the zonal steering flow is at least one standard deviation below average, the percentage increases to 58%, but is reduced to 11% when the zonal steering flow is at least one standard deviation above average. This suggests that the risk of landfall over Mozambique is indeed related to the zonal steering flow, with a probability about 5 times higher when the zonal steering flow is more than one standard deviation below average than when it is more than one standard deviation above average. If the zonal steering flow could be predicted a month or more in advance, it could be used as a predictor for the risk of landfall over Mozambique.
Several observational studies ( Saunders and Harris 1997 ; Goldenberg and Shapiro 1996 ) and model experiments ( Vitart and Anderson 2001 ) have demonstrated that warmer SSTs are conducive to a significant increase of tropical cyclone activity over the Atlantic. SSTs have also an effect on the frequency of tropical cyclones over the SIO. Jury et al. (1999) uses SSTs averaged over the region 8°–22°S and 50°–70°E as a predictor for the frequency of tropical cyclones over the SIO. Xie et al. (2002) demonstrate that warmer SSTs produced by the propagation of oceanic Rossby waves across the SIO lead to significantly more tropical cyclone days.
All the SIO tropical cyclone seasons have been classified according to the zonal steering flow and anomalous SST averaged over the region where most tropical cyclones originate (8°–22°S; 50°–110°E) and over the period January to March ( Fig. 4a ). The years with landfall are marked with a square. According to Fig. 4a , there is a strong correlation between SSTs and zonal steering flow. Years with more positive zonal steering flow coincide with years with high SIO SSTs. As discussed in the previous section, the percentage of years with landfall increases with more negative zonal steering flow. Overall, years with higher SSTs do not display more frequent landfalls. However, when the zonal steering flow is more negative, the percentage of years with landfall increases with warmer SSTs. If we consider only the years when the zonal steering flow is at least one standard deviation below average, then years with landfall display significantly warmer SSTs with a confidence level of 90% according to the KS test. Figure 4 has been divided into four regions. Region I is the region with low zonal steering flow (at least one standard deviation below average) and positive SST anomalies (calculated from the 1950–2000 climatology). During the past 51 yr, only four seasons are within this domain. Three of them had a landfall over Mozambique (75% of the cases). Over region II (steering flow at least one standard deviation below average and negative SST anomalies), the percentage of years with landfall decreases to 36%, which is about half that in region I. The difference of tropical cyclone landfall statistics between the two La Niña seasons 1999 and 2000 could be explained by the fact that 2000 is in region I, whereas the inactive tropical cyclone season 1999 is in region II. Over regions III and IV, no signal is evident. This result suggests that the impact of SSTs is particularly important when the steering flow is favorable for the possibility of landfall.
The vertical wind shear is known to have a significant impact on Atlantic tropical cyclones ( Gray 1984 ; Goldenberg and Shapiro 1996 ; Vitart and Anderson 2001 ) and explains mostly why the Atlantic tropical storm activity is significantly reduced during El Niño events. The impact of the vertical wind shear on the tropical cyclone frequency is due to the ventilation of the warm core above the center of the cyclone. A figure similar to Fig. 4 has been produced (not shown), but this time the tropical cyclone seasons have been classified according to vertical wind shear and steering wind. Unlike with SSTs, if we consider only the years with zonal steering flow one standard deviation below average, there is no significant difference of vertical wind shear between the years with tropical cyclone landfalls and those without. Therefore, only the steering wind and the SIO SSTs will be considered as predictors for the risk of landfall over Mozambique in the rest of this paper.
ENSO is the most important source of interannual variability in the Tropics. It is often used as a predictor for tropical cyclone activity over the Atlantic ( Gray et al. 1992 ), the western North Pacific ( Chan et al. 1998 ) and the Australian basin ( Nicholls 1992 ). The present section will investigate its impact on the zonal steering flow and SIO SSTs. In the present paper, El Niño seasons are defined as the seasons when the Niño-3.4 (5°N–5°S, 120°–170°W) SSTs averaged over the period January–March are at least one standard deviation above the 1950–2000 climatology, and La Niña seasons when Niño-3.4 SSTs are at least one standard deviation below climatology. The results presented in this paper are not sensitive to the choice of the ENSO index. The choice of Niño-3.4 was motivated by the fact that it is a widely used index for ENSO activity. The definition of ENSO years may not be consistent with other definitions in which an ENSO year is defined as the year where the ENSO event starts, as in Bove et al. (1998) for instance. Following our definition, there have been 10 El Niño seasons and 11 La Niña seasons over the period 1950–2000. In Fig. 2 , El Niño years are marked with diamonds and La Niña years with squares. It appears clearly that El Niño seasons generally correspond to positive anomalies of the zonal steering flow, whereas La Niña seasons generally correspond to negative anomalies. This is confirmed by a KS test, which indicates that the 10 El Niño years display a zonal steering flow significantly more positive than La Niña years with a confidence level larger than 95%. The linear correlation between the interannual variability of zonal steering flow and the Niño-3.4 SSTs is 0.7 (99.99% level of confidence). The impact of ENSO on the zonal steering flow over the SIO suffers some exceptions, such as 1989, which was a La Niña season but with a positive zonal steering flow over the SIO, or 1990 which was not an El Niño season, but which displayed a very high and positive zonal steering flow. Therefore there is no perfect match between ENSO and the zonal steering flow over the SIO, but El Niño significantly increases the probability of a positive zonal steering flow, whereas La Niña increases the risk of a negative zonal steering flow. The next section will demonstrate that the strong link between ENSO and the zonal steering flow is due to a remote impact of Pacific equatorial SSTs on the wind circulation over the SIO. Because of its significant link with the zonal steering flow, ENSO is likely to impact the risk of landfall over Mozambique. Historical records of tropical cyclones over the SIO show that tropical cyclone landfalls occurred during 25% of all the tropical cyclone seasons. This percentage increases to 45% during La Niña seasons and reduces to 10% during El Niño seasons. Therefore, the probability of landfall over Mozambique seems to be 4.5 times higher during a La Niña year than during an El Niño year. Although the data is too short to prove its significance, this result suggests that ENSO impacts the risk of landfall over Mozambique. Because of its link with the zonal steering flow, ENSO could replace the zonal steering flow as a predictor for the risk of landfall over Mozambique.
ENSO also impacts local SSTs over the SIO. Xie et al. (2002) discuss the interannual variability of SIO SSTs, and found that ENSO is the dominant forcing for SIO thermocline variability. When an El Niño event takes place, anomalous easterlies appear in the equatorial Indian Ocean, forcing a westward-propagating downwelling oceanic Rossby wave in the SIO. This explains why the SSTs during the 10 El Niño seasons are significantly warmer than during the 11 La Niña seasons, with a level of confidence of 95% according to the KS test. The impact of ENSO on both the zonal steering flow and SIO SSTs explains the significant correlation (0.6) between these two quantities (e.g., Fig. 4a ).
El Niño and La Niña seasons since 1950 have been classified according to SST anomalies and the zonal steering flow in a similar way to Fig. 4a ( Fig. 4b ). It appears clearly that El Niño years largely outnumber La Niña years in region IV, whereas La Niña seasons greatly outnumber El Niño seasons in regions I and II, where the probability of landfall is higher. However, if we consider only regions I and II, La Niña seasons do not display significantly lower SSTs than El Niño seasons of the same region. Xie et al. (2002) identified SST variability off Sumatra, which is not necessarily linked to ENSO, as having an impact on the SST variability over the SIO. Therefore, some of the SIO SST variability is not related to ENSO. This variability may explain why La Niña years like 1996 and 2000 displayed warmer SSTs than expected for a La Niña season.
In summary, La Niña conditions over the tropical Pacific and positive SST anomalies in the SIO seem to be conducive to an increase of tropical cyclone landfall over Mozambique. However, the data length (51 yr) is too short to prove this result, because only 2 yr (both with landfalls) fulfill both conditions. There is also some uncertainty in the quality of the NCEP reanalysis data. However, a recent 40-yr reanalysis from the European Centre for Medium-Range Weather Forecasts (ECMWF) produces a year-to-year variability in the SIO winds that is in good agreement with the NCEP reanalysis. In addition, the links between ENSO, the zonal steering flow, and tropical cyclone landfall seem to be stronger in the more recent part of the analysis, when the data are of better quality. The use of GCM integrations supports the overall results, as will be discussed in the next section.
3. Sensitivity studies using a high-resolution AGCM
A series of sensitivity studies using an AGCM forced by prescribed SSTs has been performed in order to evaluate the impact of SSTs on the tropical cyclones simulated by the AGCM. The model resolution is T L 159 L 40, which represents a spectral resolution of T159 in the free atmosphere and a Gaussian grid spacing of 1.125° × 1.125° at the surface with 40 vertical levels. The AGCM (IFS cycle 23r4) has been integrated for 3 months forced by prescribed SSTs in order to evaluate the sensitivity of model tropical storms over the SIO to SSTs. Since the length of the model integrations exceeds the limits of deterministic predictability, a single model integration is certainly not enough to evaluate the risk of landfall over Mozambique. Therefore, the AGCM has been integrated with 20 different initial conditions, taken from the ECMWF operational analysis from 15 November to 21 December 1999, at 2-day intervals. In order to remove the effect of the initial state, the first 2 weeks of the forecasts have been discarded. Since the starting dates are not the same, the period covered by the integration varies from one member of the ensemble to another, but this is unlikely to generate significant differences in tropical cyclone numbers.
In order to clarify the role of SSTs in the Indian and Pacific Ocean basins, a series of experiments with different SSTs was conducted. For this purpose, a series of 20-member ensemble runs as described earlier was conducted. The initial conditions vary from one member of the ensemble to another, but are the same in all the sets of experiments. The key aspect of the design of the sets of experiments is that the only difference between the experiments is the SST forcing. Therefore all the significant differences in tropical storm statistics and large-scale circulation between the 20-member ensemble integrations can only be attributed to the difference in SSTs.
To evaluate the impact of ENSO on model tropical cyclones, a 20-member integration of the AGCM forced by SSTs of 1999/2000 (EXP2000) has been compared to a 20-member ensemble forced by SSTs of 1997/98 (EXP1998). In EXP1998, the atmospheric model has been forced by observed SSTs during one of the strongest El Niño events on record. In EXP2000, the prescribed SSTs correspond to La Niña conditions. The present section will explore the differences in the large-scale circulation and the tropical storm statistics in the two sets of experiments. However, SSTs outside the tropical Pacific region could also have an impact on the statistics of tropical cyclones. Therefore, in order to isolate the impact of tropical Pacific SSTs, two additional 20-member ensembles have been generated. In EXP2000_Pac, the prescribed SSTs correspond to the 1997/98 season everywhere, except over the tropical Pacific (20°N–20°S, 120°–200°E) where SSTs of 1999/2000 have been imposed. Therefore, the only difference between EXP1998 and EXP2000_Pac is the SST forcing over the tropical Pacific. EXP1998_Pac has the opposite setting to EXP2000_Pac—that is, SSTs of 1999/2000 are used everywhere except over the tropical Pacific, where SSTs of 1997/98 are imposed. A summary of the experiment design is displayed in Table 1 .
1) Zonal steering flow
Figure 5a displays the difference in the NCEP reanalysis between the zonal steering flow averaged over the period December–January–February 2000 and the zonal steering flow averaged over the period December–January–February 1998. Over the SIO, the zonal steering flow is weaker in 2000 than in 1998 over the main tropical cyclone development region (between 10° and 20°S). It is not clear at this point if this is a consequence of ENSO or it is due to other factors, such as local SSTs. The difference between the zonal steering flow simulated by EXP2000 and EXP1998 ( Fig. 5b ) displays a pattern that is very similar to the one from the NCEP reanalysis, although its amplitude over the eastern Pacific seems to be underestimated by the model. Over the SIO, EXP2000 simulates a zonal steering flow significantly lower than in EXP1998, with a confidence level larger than 95% according to the KS test.
In order to estimate if the difference in zonal steering flow is due to a remote impact of eastern Pacific SSTs, the zonal steering flows in EXP2000_Pac and EXP1998_Pac have been compared to the zonal steering flow in EXP1998 ( Figs. 5c and 5d ). The difference between the zonal steering flow of EXP2000_Pac and EXP1998 is similar to the difference between EXP2000 and EXP1998. In particular the zonal steering flow over the SIO is significantly lower in EXP2000_Pac than in EXP1998. Since the only difference between EXP2000_Pac and EXP1998 is the tropical Pacific SSTs, this suggests that the reduction of zonal steering flow simulated by the model between 1999/2000 and 1997/98 is due to a teleconnection from the Pacific. EXP1998_Pac and EXP1998 have the same SSTs over the tropical Pacific, but different SSTs elsewhere. EXP1998_Pac does not display a significant decrease of zonal steering flow compared to EXP1998 ( Fig. 5c ), indicating that SSTs outside the tropical Pacific have a small effect and supporting the result that the significant reduction of zonal steering flow between EXP2000 and EXP1998 is due to a remote impact of tropical Pacific SSTs, and, therefore, to ENSO.
2) Tropical storm statistics
The model tropical cyclones are tracked using an improved version of the objective procedure described in Vitart and Stockdale (2001) . In the present paper, all the criteria need to be verified only twice along the whole trajectory, instead of all times, and the maximum permitted distance between two successive tropical cyclone positions has been increased. These changes improve the realism of the tropical cyclone tracks and help to capture portions of the tracks where the tropical cyclone has the intensity of a tropical depression. In order to evaluate its skill in detecting tropical cyclones, the objective procedure has been applied to 9 months of ECMWF operational analyses interpolated to the same resolution as the AGCM from 1 September 1999 to 1 June 2000 (the 2000 tropical cyclone season). Figure 6 displays the tropical cyclone tracks detected by the new objective procedure, and can be compared to the top panel of Fig. 1 , which displays the tropical cyclone tracks from JTWC during the same period. The tropical cyclone tracking procedure detects 9 of the 10 observed tropical cyclones during the 2000 SIO tropical cyclone season. Tropical Cyclone Kirrily was not detected because it is too weak in the ECMWF operational analysis. On the other hand, the procedure detects two additional systems that were classified as tropical depressions by JTWC but have tropical storm intensity in the ECMWF operational analysis. In summary, the objective procedure seems to detect tropical cyclones in the analysis rather well. The two false alarms and the nondetection of Tropical Cyclone Kirrily are more likely due to inconsistencies between ECMWF operational analyses and JTWC’s tropical storm statistics, than due to deficiencies in the tropical cyclone detection algorithm. The tracks of the detected tropical cyclones look consistent with observed tracks. Most importantly for the present paper, the two landfalls of Leon-Eline and Hudah are well detected by the objective procedure ( Fig. 6 ), and no nonobserved landfall was detected.
The tropical cyclones simulated by the AGCM have been tracked using the algorithm mentioned earlier. Table 2 displays the frequency of tropical cyclones simulated in the different experiments. Table 3 displays the observed frequency. By comparing Table 2 with Table 3 , it appears that the model simulates less than half as many tropical cyclones as were observed. The low global frequency of model tropical storms in the ECMWF seasonal forecasting system has been discussed in Vitart and Stockdale (2001) , and is most probably caused by the cumulus parameterization of the AGCM.
The frequency of SIO tropical cyclones varies greatly from one experiment to the other ( Table 2 ). In EXP2000, the frequency of tropical storms is about twice as large as in EXP1998, as observed. The KS test applied to the 20-member ensemble indicates that the difference is significant with a confidence level exceeding 99%. EXP2000_Pac simulates significantly more tropical storms than all other experiments (confidence level of 99%). Since the only difference between EXP2000_Pac and EXP1998 is the tropical Pacific SSTs, this suggests that tropical Pacific SSTs have a significant impact on the frequency of SIO tropical storms. This is probably due to the fact that La Niña conditions over the tropical Pacific significantly reduce the vertical wind shear over the SIO in EXP2000_Pac (not shown), which creates more favorable conditions for tropical cyclone genesis. EXP2000_Pac simulates about twice as many tropical storms as EXP2000, although both experiments have the same SST forcing over the tropical Pacific. This is likely due to the warmer SSTs over the SIO in EXP2000_Pac than in EXP2000. The difference in local SSTs between these two experiments exceeds 2 K over most of the SIO, which is large enough to impact the frequency of tropical cyclones (see section 2 ). This is also confirmed by the very low number of tropical cyclones in EXP1998_Pac, with negative SST anomalies over the SIO and El Niño conditions over the tropical Pacific. Both conditions are conducive to less tropical cyclone activity over the SIO. This result suggests a dual impact of ENSO on SIO tropical cyclone frequency. El Niño conditions are conducive to a significant increase of vertical wind shear over the SIO (not shown) and to warmer SSTs over the SIO. The increase of vertical wind shear is conducive to less SIO tropical cyclones, whereas the increase of SIO SSTs is conducive to more tropical cyclones. These impacts are of opposite sign, and this may explain why the interannual frequency of tropical cyclones over the SIO is poorly correlated with ENSO (correlation of 0.013 over the period 1950–2000).
The tropical cyclone tracks vary significantly from EXP2000 to EXP1998 ( Fig. 7 ). Tropical cyclones in EXP1998 tend to recurve or die east of Madagascar, whereas tropical cyclones in EXP2000 tend to cross Madagascar and sometimes make a landfall over Mozambique. Figures 8a,b display the distribution of tropical cyclone days in EXP1998 and EXP2000 after normalization by the total number of tropical cyclone days over the entire basin simulated by each experiment. Figure 8c displays the difference between the two experiments. EXP2000 displays more tropical cyclone activity west of Madagascar, but less activity east of Madagascar. The KS test applied to the ensemble distribution of the number of tropical cyclone days averaged over the region west of Madagascar (25°–15°S, 30°–50°E) indicates that the difference between EXP1998 and EXP2000 is significant with a confidence level exceeding 95%. The same test applied to the region east of Madagascar (15°–25°S, 50°–60°E) indicates that the difference in that region is also significant with a confidence level exceeding 95%. This result demonstrates that in the model, the SST forcing has a significant impact on the tropical cyclone tracks.
EXP2000_Pac exhibits similar tracks to EXP2000, whereas EXP1998_Pac exhibits tracks consistent with the tracks in EXP1998. Figures 9a,b display the distribution of tropical cyclone days in EXP2000_Pac and EXP1998. The difference between EXP2000_Pac and EXP1998 ( Fig. 9c ) is consistent with the difference in tropical cyclone days between EXP2000 and EXP1998 ( Fig. 8c ). The KS test also shows that this difference is significant. Since the only difference between EXP1998 and EXP2000_Pac is the SST forcing over the tropical Pacific, this result demonstrates that the difference in tracks between EXP1998 and EXP2000 is essentially due to the remote impact of tropical Pacific SSTs.
According to the previous paragraphs, the tropical Pacific SSTs have a significant impact on the frequency and tracks of tropical cyclones over the SIO. One would expect that these differences have significant consequences on the risk of landfall over Mozambique. The number of tropical cyclone landfalls over Mozambique has been counted for the four sets of experiments and the results are displayed in Table 2 . When forced by SSTs of 2000 (EXP2000), 14 of the 20 AGCM integrations simulate a landfall over Mozambique, whereas only one member of the ensemble simulates a landfall when forced by SSTs of 1998 (EXP1998). The difference is significant with a confidence level of 99.9% according to a simple binomial test. In EXP2000 the proportion of landfalling storms is 19%, which is close to the observed one ( Table 3 ). In EXP1998, the percentage of tropical cyclones with a landfall over Mozambique is just 2%. The difference in the probability of landfall between both experiments is significant, and this demonstrates that the risk of landfall over Mozambique in the model is affected by SSTs. Thus the results obtained with the model look consistent with observations, supporting the conclusions of section 2 .
The difference between EXP2000_Pac and EXP1998 is even more striking, with 26 landfalls in EXP2000_Pac and just 1 in EXP1998. The only difference between the two experiments is the tropical Pacific SSTs. This demonstrates that the tropical Pacific SSTs have a significant impact on the risk of landfall over Mozambique. This is also found to be true when comparing EXP2000 and EXP1998_Pac, experiments that differ only in the tropical Pacific SSTs.
EXP2000_Pac simulates significantly more tropical cyclone landfalls over Mozambique than EXP2000, although both experiments were forced by the same SSTs over the tropical Pacific. Interestingly, the fractions of tropical cyclone landfall in EXP2000 and EXP2000_Pac are very close, near 20% ( Table 2 ), but EXP2000_Pac simulates about twice as many tropical cyclones as EXP2000. This could be explained by warmer SSTs over the SIO in EXP2000_Pac than in EXP2000. The present section will investigate this hypothesis.
In order to evaluate the impact of local SSTs, the SIO SSTs have been warmed and cooled by 0.5 K over the main tropical cyclone development region in SIO (10°–25°S, 30°–110°E). The choice of 0.5 K was made because it is close to the amplitude of the standard deviation of SSTs over the SIO in La Niña years. Twenty-member integrations of the AGCM forced by the modified SSTs (EXP2000_SIN+0.5 and EXP2000_SIN–0.5) have been compared to EXP2000. Table 4 describes the setting of the two experiments. EXP2000_SIN+0.5 simulates significantly more tropical cyclones (103 events instead of 73) than the control experiment EXP2000 with a confidence level of 95%. The number of landfalls is slightly higher (19 instead of 14), but the percentage of tropical cyclones with landfall is about the same in both experiments ( Table 5 ). On the other hand, cooling SIO SSTs by 0.5 K reduces the number of landfalls to 7 (instead of 14), which is significantly less than in EXP2000_SIN+0.5 (within the 95% level of confidence), although the total number of tropical cyclones is not significantly reduced compared to EXP2000. The tracks are not significantly different between the three ensemble integrations (not shown). However, tropical cyclones are significantly less intense in EXP2000_SIN–0.5, and as a consequence have a shorter duration. This may explain why the percentage of tropical cyclones with a landfall over Mozambique in EXP2000_SIN–0.5 is only half that in EXP2000.
The sensitivity experiments described in this section suggest that tropical Pacific SSTs have a significant impact on the risk of landfall over Mozambique, through their impact on the large-scale circulation. Model tropical storms tend to have a more zonal track during the 2000 La Niña season than during the 1998 El Niño season. The experiments also suggest that SIO SSTs impact the risk of landfall through the frequency and intensity of tropical cyclones. These results are consistent with the observational analysis presented in section 2 . From these sensitivity experiments, it can be concluded that an AGCM can simulate the impact of SSTs on the risk of landfall over Mozambique.
In order to evaluate the skill of a coupled GCM to predict explicitly the risk of landfall over Mozambique, a coupled ocean–atmosphere model has been integrated for 3 months starting on 1 January for each year from 1987 to 2001 (15 yr). The atmospheric component is the same as that used in section 3 . In order to remove the most deterministic part of the forecast, the first 10 days of integrations have been removed. The atmospheric initial conditions have been perturbed using singular vectors ( Palmer et al. 1998 ) and stochastic perturbations are applied to the physics tendencies ( Palmer 2001 ) during the integrations. Oceanic initial conditions are perturbed in two ways: random perturbations are applied to the wind stress during the data assimilation in order to produce five different realizations of the ocean state; random perturbations are also applied to the SSTs in order to produce a 10-member ensemble. The SST perturbations have been created by taking the difference between two different weekly mean SST analyses from 1985 to 1999, and also by taking the differences between a weekly mean SST analysis and its 1-week persistence. In order to have a 3D structure, the SST perturbations are linearly interpolated to zero at an oceanic depth of 40 m. The SST perturbations are added to the SSTs produced by the operational ocean analyses with a plus (+) and minus (–) sign.
The objective procedure for tracking model tropical cyclones described in section 3 has been applied to each member of the ensemble from 1987 to 2001. The mean number of simulated tropical cyclones in the period from 11 January to 31 March is 4.6, which is lower than the observed mean number of tropical cyclones over the same period of time (7.5). This is likely to originate from the atmospheric component of the coupled GCM, since the AGCM used for the sensitivity experiments described in section 3 displays a similar bias in the frequency of SIO tropical cyclones ( Tables 2 and 3 ).
The frequency of predicted SIO tropical cyclones displays an interannual variability that is positively and significantly correlated with the observed interannual variability (correlation of 0.55 between the mean of the ensemble and observations), although the model fails to predict the exceptionally strong number of SIO tropical cyclones in 1994. The interannual variability predicted by the higher-resolution forecast discussed here is more realistic than the one predicted by the operational seasonal forecasting system ( Vitart and Stockdale 2001 ).
The coupled model predicts a significant interannual variability in tropical cyclone tracks. Figure 10 shows an example of such strong interannual variability. In Fig. 10a , the tracks of all the tropical cyclones generated by 10-member ensemble integrations of the coupled GCM starting on 1 January 2000 are displayed. They look consistent with the observations ( Fig. 1a ). A couple of model tropical cyclones have a westward trajectory and landfall over Mozambique as did Leon-Eline and Hudah, although their genesis location is in the central part of the SIO instead of the eastern edge of the basin. Fig. 10b shows the predicted trajectories of the ensemble forecasts starting on 1 January 1998. As in the observations, most of the tropical cyclone activity is concentrated just east of Madagascar with few tropical cyclones crossing the island.
The number of landfalls over Mozambique has been counted for each member of the ensemble. The mean number of landfalls (averaged over the 10 members of the ensemble) has been calculated for each year from 1987 to 2001. As the model simulates fewer tropical cyclones than observed by a factor of 1.5, the number of landfalls per year and per ensemble member has been multiplied by 1.5. The interannual variability of the predicted number of landfalls is significantly correlated with the predicted interannual variability of Niño-3.4 SSTs (correlation of 0.7). The four El Niño years (1987, 1992, 1995, and 1998) correspond to four of the years where the model predicts the lowest risk of landfall over Mozambique ( Fig. 11 ). The coupled model predicts a risk of landfall over Mozambique to be above average during 3 of the 4 La Niña years (1996, 1999, and 2000), but not in 1989 ( Fig. 11 ). Therefore, the impact of ENSO on the risk of landfall over Mozambique, discussed in sections 1 and 2 , seems to be present in the forecast.
During the 15 yr of the hindcast, Mozambique has been hit by tropical cyclones in 4 yr (1988, 1994, 1996, and 2000). Interestingly, the model predicts a risk of landfall during these 4 yr as greater than average. All the years where the model predicts a reduced risk of landfall coincide with years with nonobserved landfall over Mozambique. There are 3 yr when the model predicts an above average risk of landfall but no tropical cyclone landfall was observed (1990, 1991, and 1999). However, the seasonal forecasts are probabilistic forecasts, not deterministic. An increased risk of landfall does not necessarily mean that there will be a landfall over Mozambique, especially when the predicted number of landfalls is less than 1. The model successfully predicts a high risk of landfall over Mozambique for the 2000 season, higher than in any other year. Interestingly, it also predicts a high risk of landfall in 1988 and 1994, which are not La Niña years. Both 1988 and 1994 seasons displayed a tropical cyclone landfall over Mozambique. Therefore, it seems that although ENSO has a significant impact on the predicted risk of landfall, other factors, such as local SST patterns, may play a significant role. The predicted high risk of landfall over Mozambique in 1988 and 1994 suggests that the model is able to predict the impact of these additional factors on the risk of landfall over Mozambique. The predicted interannual variability of tropical cyclone landfall is positively and significantly correlated with the observed interannual variability (correlation of 0.81 with a level of confidence of 99%). In summary, this hindcast experiment strongly suggests that the high-resolution coupled system has skill in predicting the number of landfalls over Mozambique.
Observational studies of section 2 suggest, but do not entirely prove, that two factors significantly impact the risk of landfall over Mozambique: ENSO and SIO SSTs. Sensitivity tests in section 3 using an AGCM reproduce this impact and therefore confirm the importance of ENSO and SIO SSTs on the risk of landfall over Mozambique. This demonstrates that an AGCM can be a very useful tool for quantifying how the variability in the large-scale circulation impacts the statistics of tropical cyclones. The observational study and the sensitivity experiments demonstrate that the skill of a dynamical model in predicting the risk of landfall over Mozambique depends strongly on its skill in predicting SSTs over the SIO and tropical Pacific.
The present paper shows that a coupled GCM with sufficiently high horizontal resolution has skill in predicting the risk of landfall over Mozambique. More especially, the coupled model predicts a number of landfalls for the 2000 tropical cyclone season that is higher than in any of the other 14 yr of the hindcast period. This result gives a strong indication that the risk of landfall over Mozambique can be predicted, and that coupled GCM integrations could be a useful tool for predicting such risk. The T L 159 horizontal resolution that was used in the present paper seems fine enough to allow the explicit seasonal probabilistic prediction of tropical cyclone landfalling. Such a high atmospheric resolution is likely to be used for operational seasonal forecasting in the coming years. Therefore, there is hope that in the near future, operational dynamical seasonal forecasting systems will be able to explicitly predict the seasonal risk of landfall over Mozambique.
Current operational seasonal forecasting systems have a horizontal resolution much coarser than the one used in the experiments described in the present paper. At such low resolution, tropical storm tracks tend to be too short and poleward ( Vitart et al. 1997 ). Therefore, it is unlikely that these operational dynamical systems have skill in predicting explicitly the risk of landfall over Mozambique. However, a study not reported in the present paper indicates that the ECMWF seasonal forecasting system with a T63 horizontal resolution displays strong skill in predicting the large-scale predictors (ENSO and SIO SSTs) a few months in advance. This suggests that current seasonal forecasting systems could be useful for the indirect seasonal prediction of the risk of landfall over Mozambique.
The present study focuses on the SIO and the risk of landfall over Mozambique prompted by the exceptional 2000 tropical cyclone season and its catastrophic consequences for Mozambique. Future plans include investigating if a coupled model could also be useful in predicting the risk of landfall over other areas. It may be possible to predict the risk of landfall over several basins such as the North Indian Ocean, the western North Pacific, and the eastern North Pacific, and North Atlantic where there is significant interannual variability of tropical cyclone statistics. For that purpose, additional GCM integrations will be needed, since the tropical cyclones seasons over these basins differ from the SIO tropical cyclone season.
Acknowledgments
The authors would like to thank the anonymous reviewers whose comments proved invaluable in improving the presentation of the material.
Citation: Journal of Climate 16, 23; 10.1175/1520-0442(2003)016<3932:SFOTCL>2.0.CO;2
- Download Figure
- Download figure as PowerPoint slide
Description of the experiments EXP2000, EXP1998, EXP2000_Pac, and EXP1998_Pac
Tropical cyclone frequency, number of landfall, and ratio of number of landfall with the total number of tropical cyclones over the SIO region. All these numbers have been averaged over the 20-member ensemble. The numbers in parentheses delimit the 95% confidence interval, calculated by assuming a Poisson distribution of tropical storm frequency and landfalls and using a standard conservative method
Observed tropical statistics over the SIO region
Description of the settings of EXP2000, EXP2000_SIN+0.5, EXP2000_SIN–0.5
Same as in Table 2 but for the experiments described in Table 4
AMS Publications
Get Involved with AMS
Affiliate sites.
Email : [email protected]
Phone : 617-227-2425
Fax : 617-742-8718
Headquarters:
45 Beacon Street
Boston, MA 02108-3693
1200 New York Ave NW
Washington, DC 200005-3928
- Privacy Policy & Disclaimer
- Get Adobe Acrobat Reader
- © 2024 American Meteorological Society
- [185.80.150.64]
- 185.80.150.64
Character limit 500 /500

Ask Another Question
Follow class ace :.
- Share full article
Advertisement
The Morning
Americans’ struggle with mental health.
We explore why rates of anxiety and depression are higher than they were before the pandemic.

By Ellen Barry
I cover mental health.
It is no mystery why rates of anxiety and depression in the United States climbed in 2020, at the height of the pandemic. But then life began a slow return to normal. Why haven’t rates of distress returned to normal, too?
Self-reported anxiety and depression have declined from the peak they reached in November 2020, when 42.6 percent of adults said they had symptoms, according to the Household Pulse Survey, a Census Bureau tool that measures well-being. Since then, that figure has declined to 20.7 percent. That’s still double the 11 percent of Americans who said the same thing before the pandemic.
In today’s newsletter, I’ll explain why. Researchers say a big reason for this stubbornly elevated distress is young people, whose low mood was not linked to the pandemic.
A youth epidemic
The share of young adults reporting anxiety and depression had been rising for about a decade before Covid struck. That continued throughout the pandemic — and did not ease as quickly when vaccines became available.
This is likely because their symptoms were tied to problems other than the virus, like economic precarity, the housing crisis, social isolation and political turmoil, said Emma Adam, a psychologist at Northwestern. “There’s so many things affecting adolescents and young adults that are about uncertainty with their future,” Adam said. “And that hasn’t changed.”
Age, of course, tracks with income. Adam’s team found that people between the ages of 18 and 39 were half as likely to live in their own home as their counterparts over 40. That means they were especially vulnerable to inflation, rent increases and job loss — just as they faced big decisions like whether to have children or own a home.
We are having trouble retrieving the article content.
Please enable JavaScript in your browser settings.
Thank you for your patience while we verify access. If you are in Reader mode please exit and log into your Times account, or subscribe for all of The Times.
Thank you for your patience while we verify access.
Already a subscriber? Log in .
Want all of The Times? Subscribe .
IMAGES
COMMENTS
Step 2: Gather Preliminary Data. Find data about Tropical Cyclone Freddy. This could include its path, wind speed, rainfall, damage caused, etc. Also, try to find data about the conditions in Mozambique before, during, and after the cyclone. This could include data about temperature, humidity, atmospheric pressure, and oceanic conditions.
Tropical Cyclone Freddy. Tropical Cyclone Freddy stands as a significant weather event in the 2023 cyclone season, illustrating the potent force and extensive impact tropical cyclones can have on regions. Initially developing in the Indian Ocean, Freddy quickly intensified, showcasing the rapid and formidable growth capability of such storms.
Tropical Cyclone Freddy made landfall on the southeastern coast of Mozambique on February 11, 2022, before continuing its path of destruction across several other Southern African countries,
24 February 2023 Climate and Environment. Tropical cyclone Freddy, one of the longest-lasting systems in the southern hemisphere, slammed into Mozambique on Friday, as UN agencies helped residents with early action. Accurate early warnings and early action on the ground helped limit loss of life over the course of the cyclone, UN officials said.
This report is produced by OCHA Mozambique in collaboration with humanitarian partners. It covers the period 29 April until the 16 May 2023. HIGHLIGHTS. Over one million people have been affected by Tropical Cyclone Freddy, floods, and cholera. Since the beginning of the rainy/cyclonic season, 1.4 million people have been affected by natural ...
The origins of Cyclone Freddy can be traced back to 4 February 2023, when the Australian Bureau of Meteorology (BoM) reported that a Tropical Low 13U had formed during an active phase of the Madden-Julian oscillation in conjunction with an equatorial Rossby wave, [4] while it was situated to the south of the Indonesian archipelago. [4] [9] The American-based Joint Typhoon Warning Center ...
The tropical cyclone Dineo made landfall over southern Mozambique on 15 February 2017. It weakened to a remnant low on 17 February, which hit Botswana on the same day and triggered heavy rainfall ...
There is still insufficient information available for a streamlined impact assessment of tropical cyclones on coastal habitats, particularly in the Mozambique Channel. Using Sentinel-1 and Sentinel-2 data, along with socio-ecological parameters including mangrove forest health and population density, we modeled the extent of flooding and its impact following the 'severe tropical storm' Ana ...
News and Press Release in English on Mozambique about Climate Change and Environment, Disaster Management, Flood and Tropical Cyclone; published on 7 Mar 2023 by WMO
SITUATION OVERVIEWMore than a million people were affected by cholera, Cyclone Freddy, and floods in Mozambique's provinces of Gaza, Inhambane, Manica, Maputo, Sofala, Tete, N. assa and Zambezia. An estimated 132,000 homes were destroyed, potentially. splacing 640,000. A total of 1,017 schools and over 5,000 kilometres of.
Hypothesis: Tropical Cyclone Idai, which struck Mozambique in March 2019, had a significant negative...
BLANTYRE, Malawi — The devastating Tropical Cyclone Freddy which has ripped through southern Africa in a rare second landfall has killed at least 216 people in Malawi and Mozambique since ...
Tropical Cyclone Eloise reached the coast of Mozambique on 23 January, with winds of around 140km/h and gusts of up to 160km/h (category 2 tro- pical cyclone equivalent).
Mozambique averages about 1.5 tropical cyclones a year and, although rarely more powerful than Category 2, they can cause a lot of damage, said Corene Matyas, a tropical cyclone researcher at the ...
Attachments. Download Report (PDF | 252.99 KB); Tropical Cyclone Eloise reached the coast of Mozambique on 23 January, with winds of around 140km/h and gusts of up to 160km/h (category 2 tropical ...
Abstract The 2000 tropical cyclone season over the South Indian Ocean (SIO) was exceptional in terms of tropical cyclone landfall over Mozambique. Observed data suggest that SIO tropical cyclones have a track significantly more zonal during a La Niña event and tend to be more frequent when local SSTs are warmer. The combination of both conditions happened during the 2000 SIO tropical cyclone ...
A possible hypothesis/Problem Statement: for the Tropical cyclone Freddie that occured in Mozambique is ""The impact of Tropical Cyclone Freddie on Mozambique's coastal communities: Assessing the extent of damage, evaluating the effectiveness of preparedness measures, and identifying strategies for enhanced resilience.". Why is this a good hypothesis statement ?
Answer: Hypothesis: The impact of Tropical Cyclone Freddy resulted in significant damage and loss of life on the East Coast of Mozambique as well as in other affected countries. The cyclone's high wind speeds, heavy rainfall, and storm surges caused flooding, landslides, and infrastructure damage, leading to displacement, injury, and loss of life.
Answers. One hypothesis about Tropical Cyclone Eloise in Mozambique is that the warming of the Indian Ocean, due to climate change, may have intensified the cyclone and contributed to its rapid intensification before making landfall in Mozambique. This hypothesis suggests that the warming of the ocean could lead to more frequent and severe ...
Researchers at Boston College set out to test this hypothesis by surveying people between the ages of 18 and 80 about their memories from the early part of the pandemic. ... Tropical Storm Debby ...